RED-ACT: Mar. 09, M4.5 Japan Gifu-ken Earthquake
RED-ACT Report
Real-time Earthquake Damage Assessment using City-scale Time-history analysis
Mar. 09, M4.5 Japan Gifu-ken Mino-chuseibu Earthquake
Research group of Xinzheng Lu at Tsinghua University ([email protected])
First reported at 06:00, Mar. 9, 2019 (Beijing Time, UTC +8)
Acknowledgments and Disclaimer
The authors are grateful for the data provided by K-NET and KiK-net. This analysis is for research only. The actual damage resulting from the earthquake should be determined according to the site investigation.
Scientific background of this report can be found at:
http://www.luxinzheng.net/software/Real-Time_Report.pdf
1. Introduction to the earthquake event
At 01:08 09 Mar, 2019 (Local Time, UTC +9), an M 4.5 (JMA) earthquake occurred in Japan Gifu-ken Mino-chuseibu. The epicenter was located at 136.7 35.4, with a depth of 40.0 km.
2. Recorded ground motions
40 ground motions near to epicenter of this earthquake were analyzed. The names and locations of the stations can be found Table 1. The maximal recorded peak ground acceleration (PGA) is 151 cm/s/s. The corresponding response spectra in comparison with the design spectra specified in the Chinese Code for Seismic Design of Buildings are shown in Figure 1.
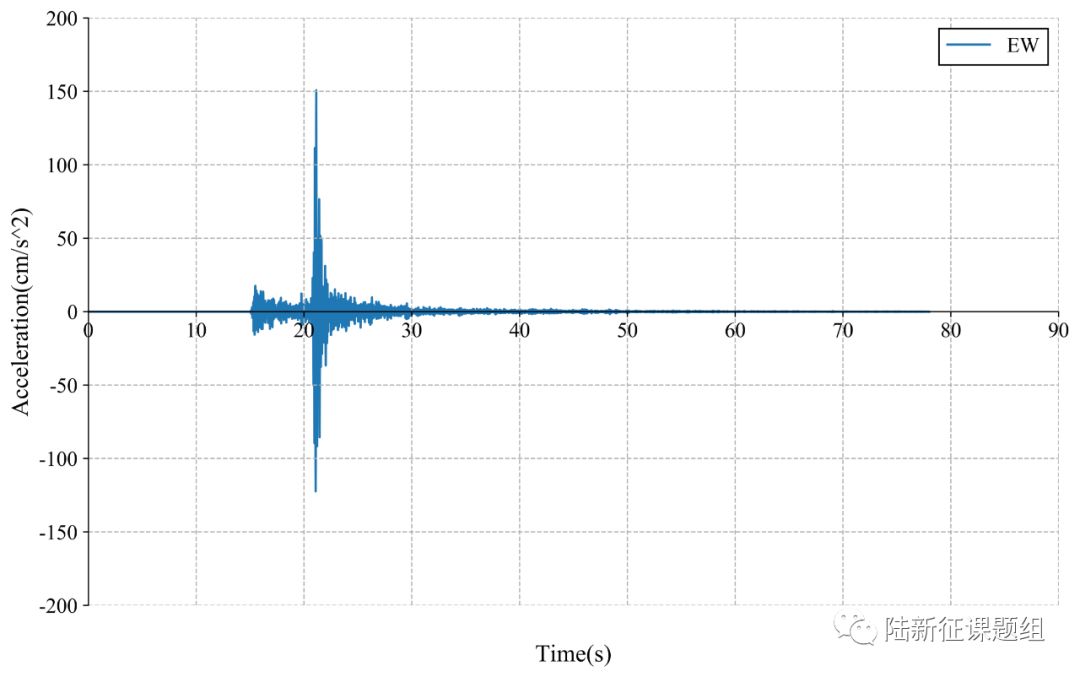
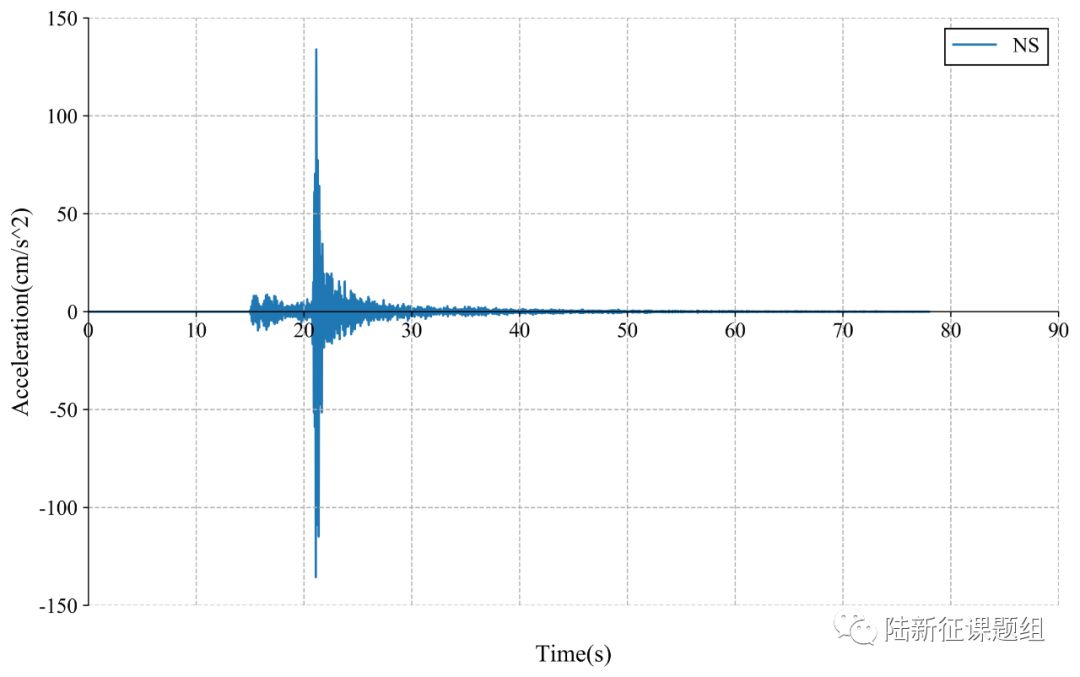
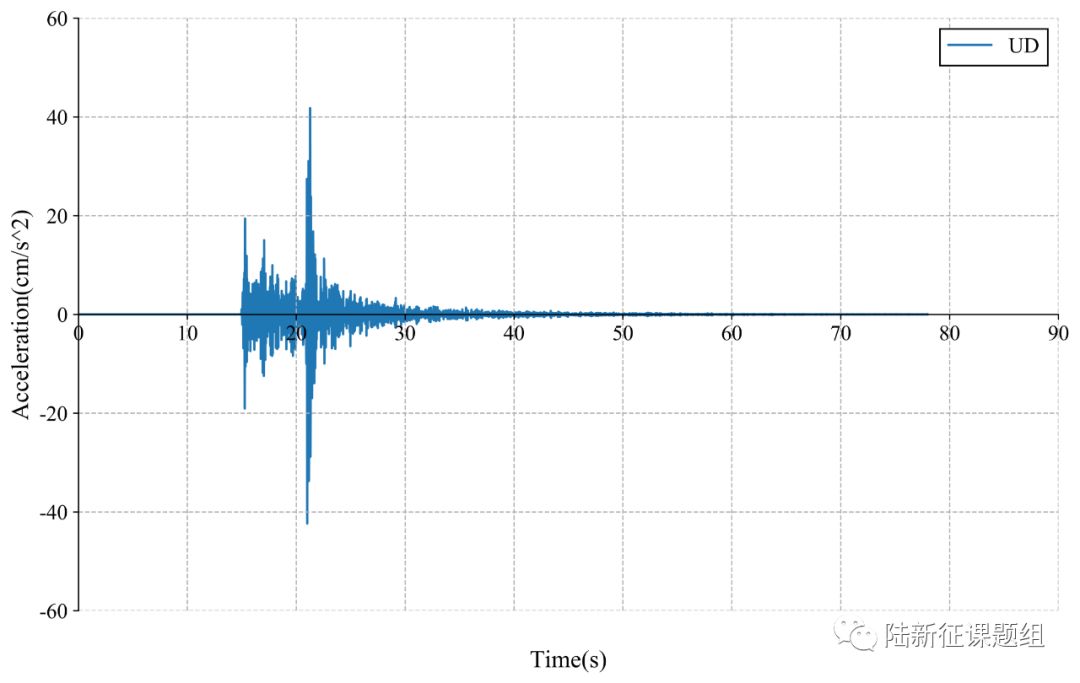
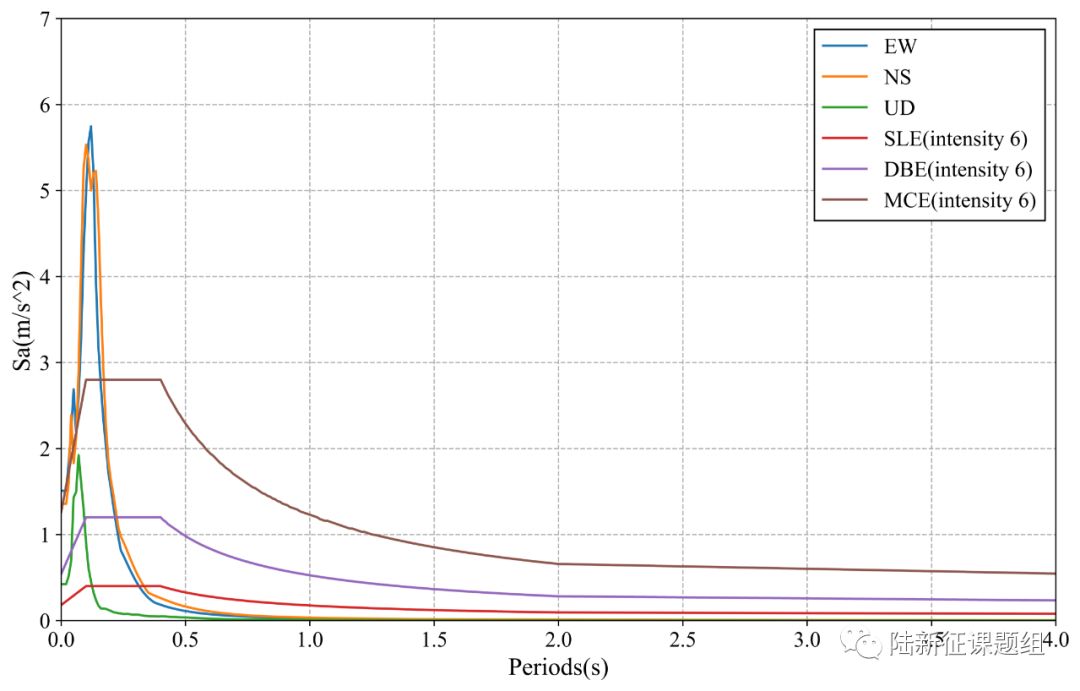
Figure 1 Response spectra of the recorded ground motions with maximal PGA
3. Damage analysis of the target region subjected to the recorded ground motions
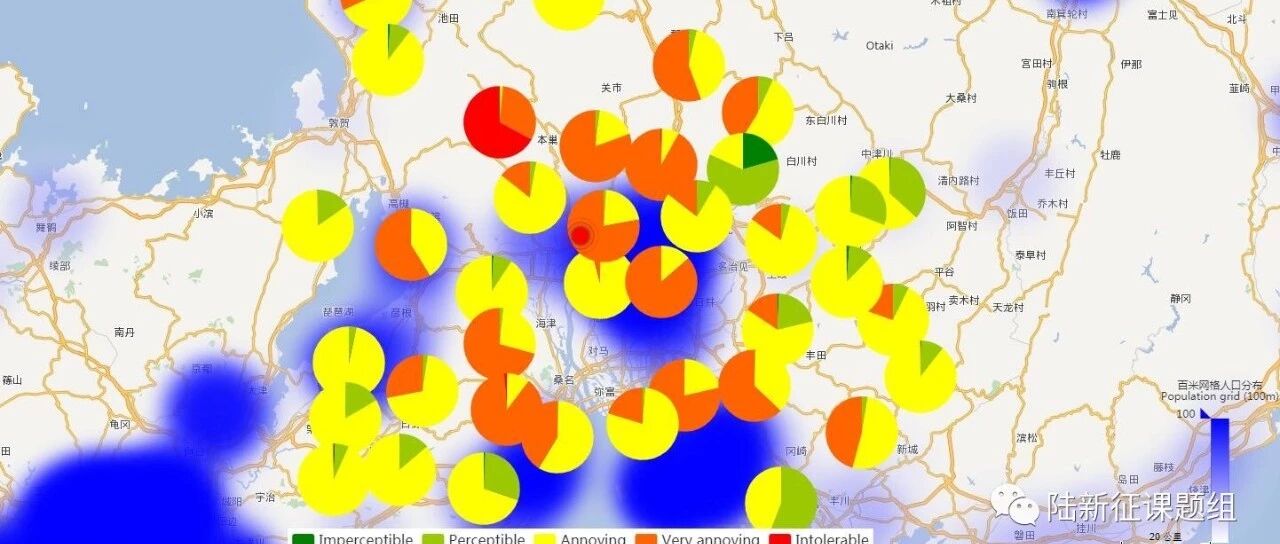
Using the real-time ground motions obtained from the strong motion networks and the city-scale nonlinear time-history analysis (see the Appendix of this report), the damage ratios of buildings located in different places can be obtained. The building damage distribution and the human uncomfortableness distribution near to different stations is shown in Figure 2 and Figure 3, respectively. These outcomes can provide a reference for post-earthquake rescue work.
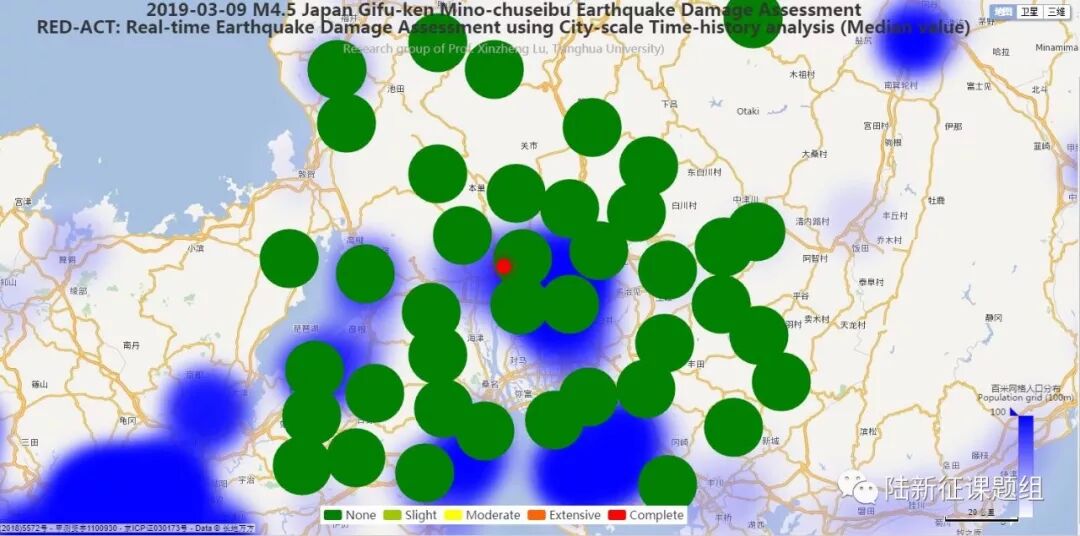
Figure 2 Damage ratio distribution of the buildings near to different stations
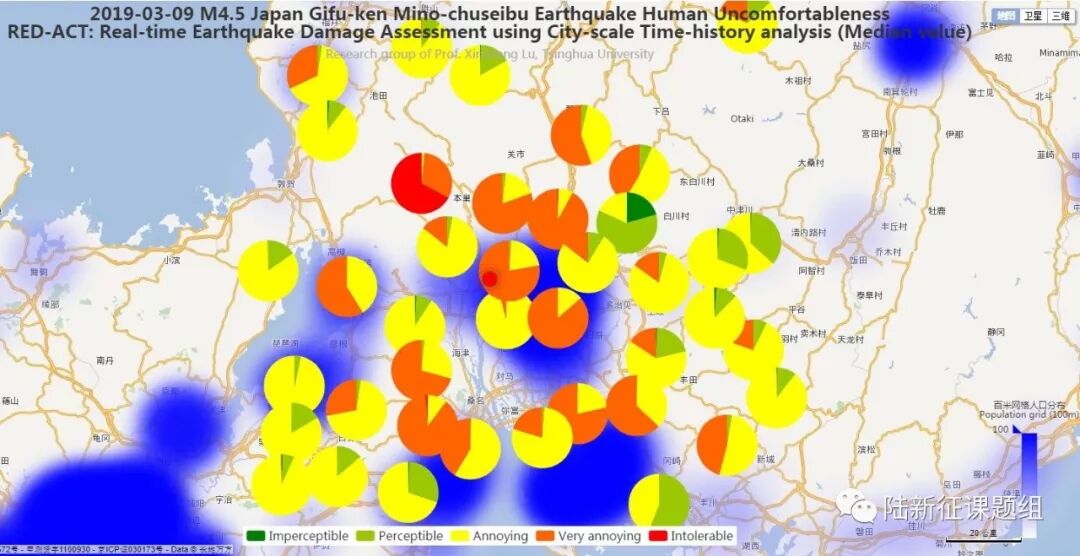
Figure 3 Human uncomfortableness distribution near to different stations
The details can be accessed at
http://www.luxinzheng.net/software/2019-03-09-Japan-4.5.html
http://www.luxinzheng.net/software/2019-03-09-Japan-4.5-Acc.html
Scientific background of this report can be found at: http://www.luxinzheng.net/software/Real-Time_Report.pdf
Table 1 Names and locations of the strong motion stations
No. Station Name Longitude Latitude
1 AIC001 136.75 35.2976
2 AIC002 136.915 35.2979
3 AIC004 136.974 35.0632
4 AIC005 137.206 35.1979
5 AIC006 137.509 35.2159
6 AIC008 137.576 35.1006
7 AIC009 137.146 35.0812
8 AIC010 137.43 34.9803
9 AIC011 136.864 34.9965
10 AIC014 137.22 34.8263
11 FKI004 136.487 35.9789
12 FKI005 136.174 35.9067
13 FKI006 136.2 35.7731
14 FKI011 136.668 35.9097
15 GIF007 137.486 36.0378
16 GIF011 136.981 35.7593
17 GIF012 136.488 35.6365
18 GIF013 137.162 35.6637
19 GIF015 136.907 35.5454
20 GIF016 137.119 35.5424
21 GIF017 136.571 35.4829
22 GIF018 137.5 35.4887
23 GIF019 137.404 35.4495
24 GIF020 136.757 35.4248
25 GIF021 137 35.4426
26 GIF022 136.471 35.2834
27 GIF023 137.216 35.3882
28 GIF024 137.387 35.3009
29 GIF026 136.741 35.5912
30 MIE001 136.494 35.1718
31 MIE002 136.507 35.0279
32 MIE003 136.636 34.9704
33 MIE004 136.449 34.8569
34 SIG002 136.024 35.4215
35 SIG003 136.264 35.377
36 SIG007 136.096 35.1339
37 SIG008 136.295 35.0701
38 SIG009 136.085 35.0051
39 SIG011 136.059 34.8779
40 SIG012 136.231 34.9043
------End------
相关研究
长按识别二维码,关注我们的科研动态