RED-ACT: Jun. 9, M5.5 New Zealand Earthquake
RED-ACT Report
Real-time Earthquake Damage Assessment using City-scale Time-history analysis
Jun. 9, M5.5 New Zealand Earthquake
Research group of Xinzheng Lu at Tsinghua University ([email protected])
First reported at 17:00, Jun. 10, 2019 (Beijing Time, UTC +8)
Acknowledgments and Disclaimer
The authors are grateful for the data provided by GeoNet. This analysis is for research only. The actual damage resulting from the earthquake should be determined according to the site investigation.
Scientific background of this report can be found at:
http://www.luxinzheng.net/software/Real-Time_Report.pdf
1. Introduction to the earthquake event
At Jun. 10 2019 3:24 (Local Time), an M 5.5 (GeoNet) earthquake occurred in New Zealand. The epicenter was located at 168.15 -44.34, with a depth of 5.0 km.
2. Recorded ground motions
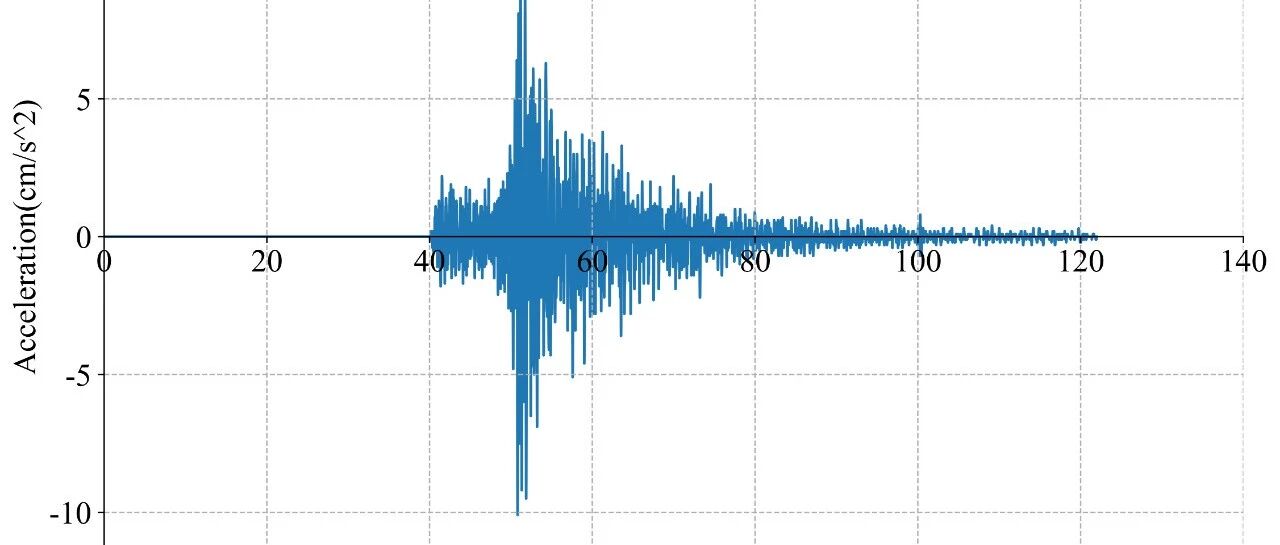
24 ground motions near to epicenter of this earthquake were analyzed. The names and locations of the stations can be found Table 1. The maximal recorded peak ground acceleration (PGA) is 10 cm/s/s. The corresponding response spectra in comparison with the design spectra specified in the Chinese Code for Seismic Design of Buildings are shown in Figure 1.
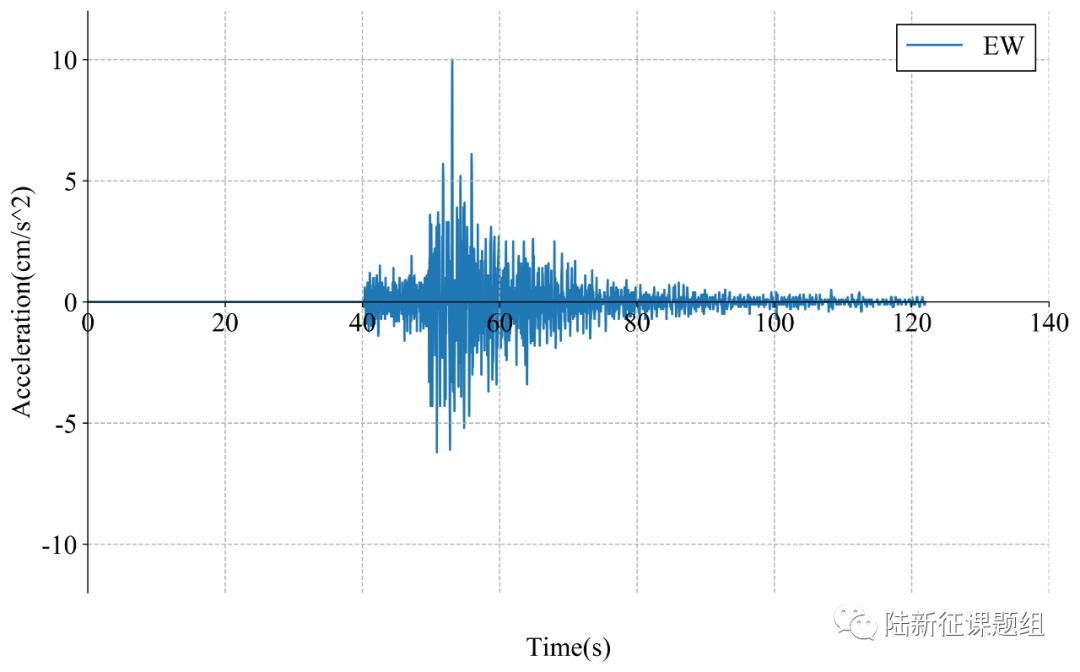
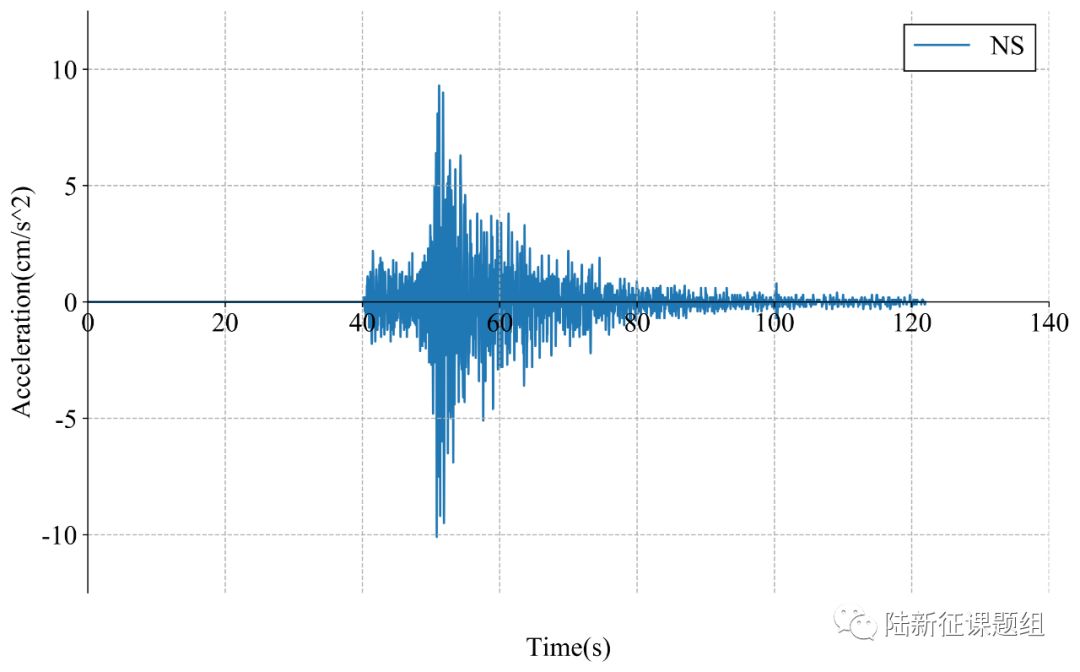

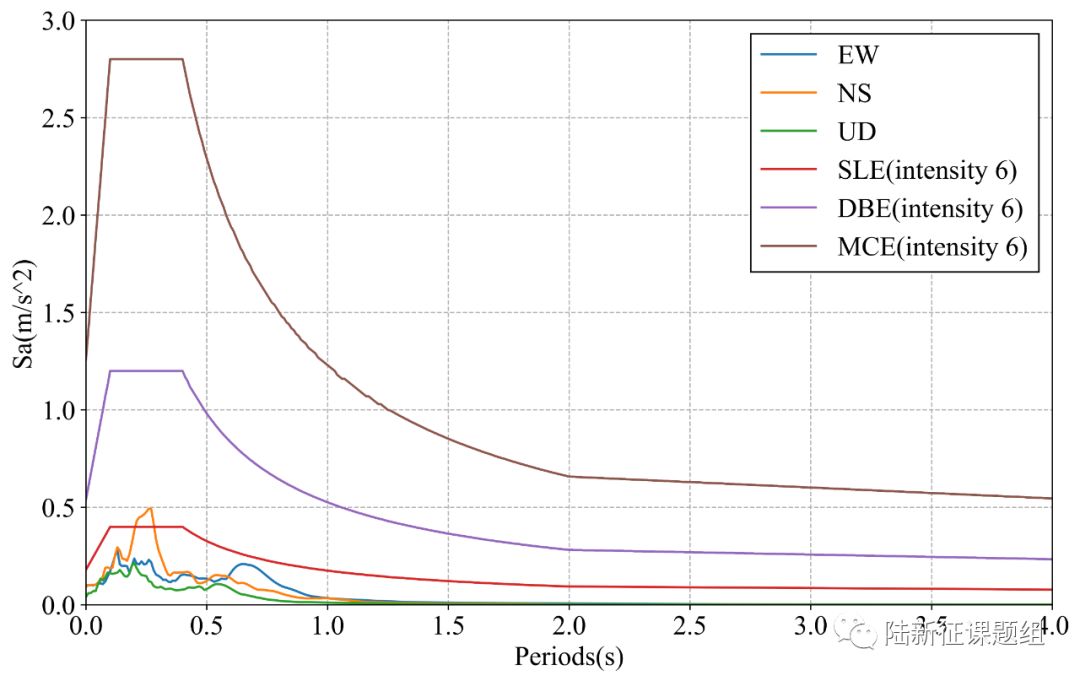
Figure 1 Response spectra of the recorded ground motions with maximal PGA
3. Damage analysis of the target region subjected to the recorded ground motions
Using the real-time ground motions obtained from the strong motion networks and the city-scale nonlinear time-history analysis (see the Appendix of this report), the damage ratios of buildings located in different places can be obtained. The building damage distribution and the human uncomfortableness distribution near to different stations is shown in Figure 2 and Figure 3, respectively. These outcomes can provide a reference for post-earthquake rescue work.
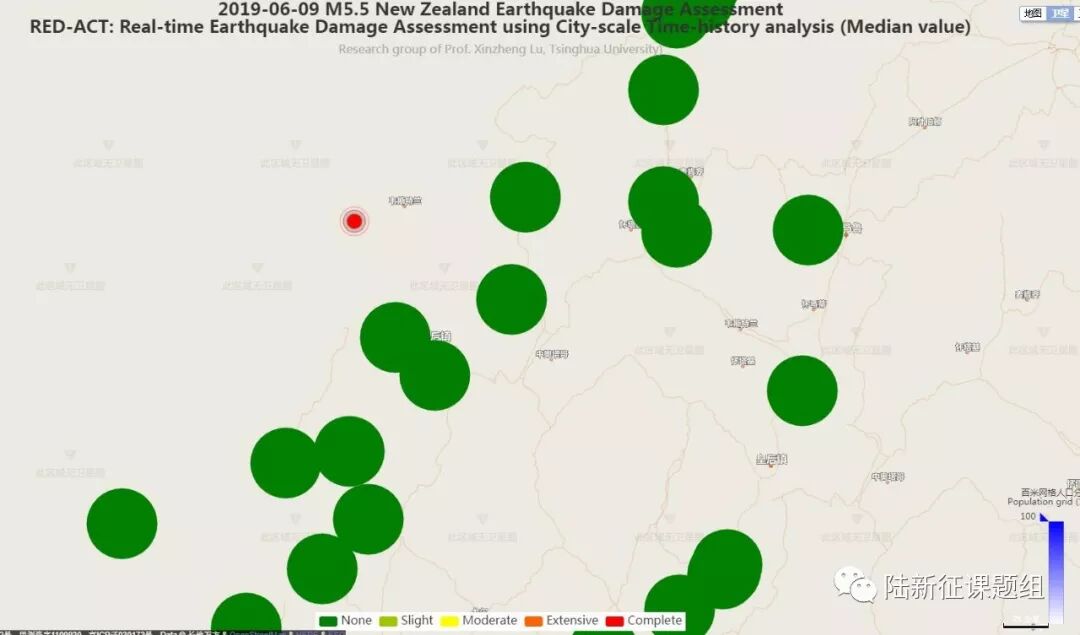
Figure 2 Damage ratio distribution of the buildings near to different stations
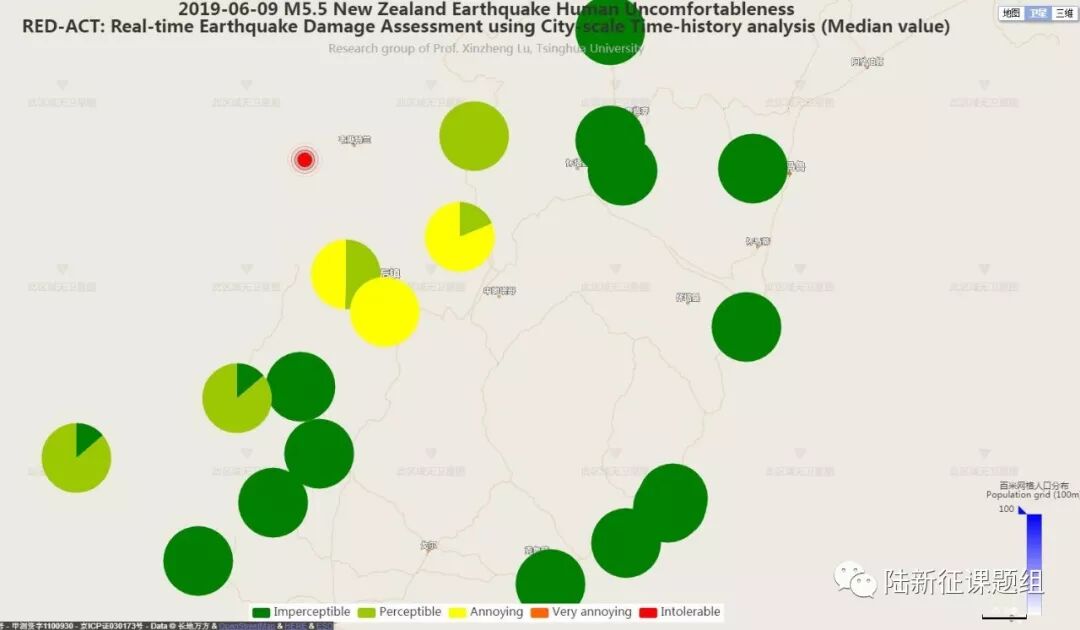
Figure 3 Human uncomfortableness distribution near to different stations
Scientific background of this report can be found at: http://www.luxinzheng.net/software/Real-Time_Report.pdf
Table 1 Names and locations of the strong motion stations
No. Station Name Longitude Latitude
1 GLNS_20 168.4064 -44.8644
2 MECS_20 169.2331 -44.2306
3 QTPS_20 168.6628 -45.0322
4 WNPS_20 169.1431 -44.6947
5 _MLZ_20 168.1183 -45.3667
6 TAFS_20 167.7192 -45.4167
7 MOSS_20 168.2378 -45.6678
8 TWAS_20 170.0983 -44.2547
9 _LBZ_20 170.1844 -44.3856
10 MCNS_20 170.0972 -43.7364
11 FJDS_20 170.1842 -43.3892
12 _WHZ_20 167.9469 -45.8925
13 WHAS_20 170.3267 -43.3161
14 RRKS_20 167.4725 -46.1475
15 WHFS_20 170.3589 -43.2611
16 OAMS_20 170.9692 -45.0997
17 _CVZ_20 171.0061 -44.3831
18 DCDS_20 170.5022 -45.8744
19 DUNS_20 170.4706 -45.9053
20 BDCS_20 169.7194 -46.2492
21 WVAS_20 170.7372 -43.0717
22 DKHS_20 170.4931 -45.9022
23 RLNS_20 166.6858 -45.6875
24 TMBS_20 170.1958 -46.0719
---End---
相关研究
长按识别二维码,关注我们的科研动态