RED-ACT: Feb. 21, M5.7 Japan Iburi-chiho Earthquake
RED-ACT Report
Real-time Earthquake Damage Assessment using City-scale Time-history analysis
Feb. 21, M5.7 Japan Iburi-chiho Earthquake
Research group of Xinzheng Lu at Tsinghua University ([email protected])
First reported at 20:46, Feb. 21, 2019 (Beijing Time, UTC +8)
Acknowledgments and Disclaimer
The authors are grateful for the data provided by 中国地震台网中心. This analysis is for research only. The actual damage resulting from the earthquake should be determined according to the site investigation.
1. Introduction to the earthquake event
At 21: 22, Feb. 21, 2019 (Local Time, UTC +9), an M 5.7 (JMA) earthquake occurred in Iburi-chiho Chutobu. The epicenter was located at 142.0 42.8, with a depth of 30.0 km.
2. Recorded ground motions
20 ground motions near to epicenter of this earthquake were analyzed. The names and locations of the stations can be found Table 1. The maximal recorded peak ground acceleration (PGA) is 368 cm/s/s. The corresponding response spectra in comparison with the design spectra specified in the Chinese Code for Seismic Design of Buildings are shown in Figure 1.
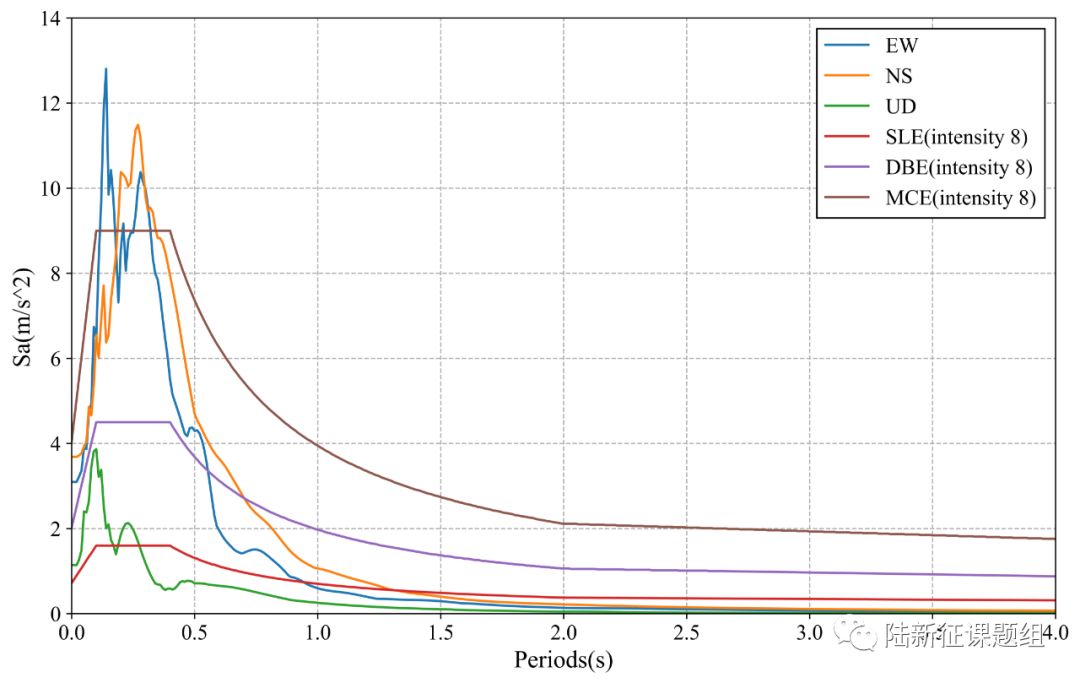
Figure 1 Response spectra of the recorded ground motions with maximal PGA
3. Damage analysis of the target region subjected to the recorded ground motions
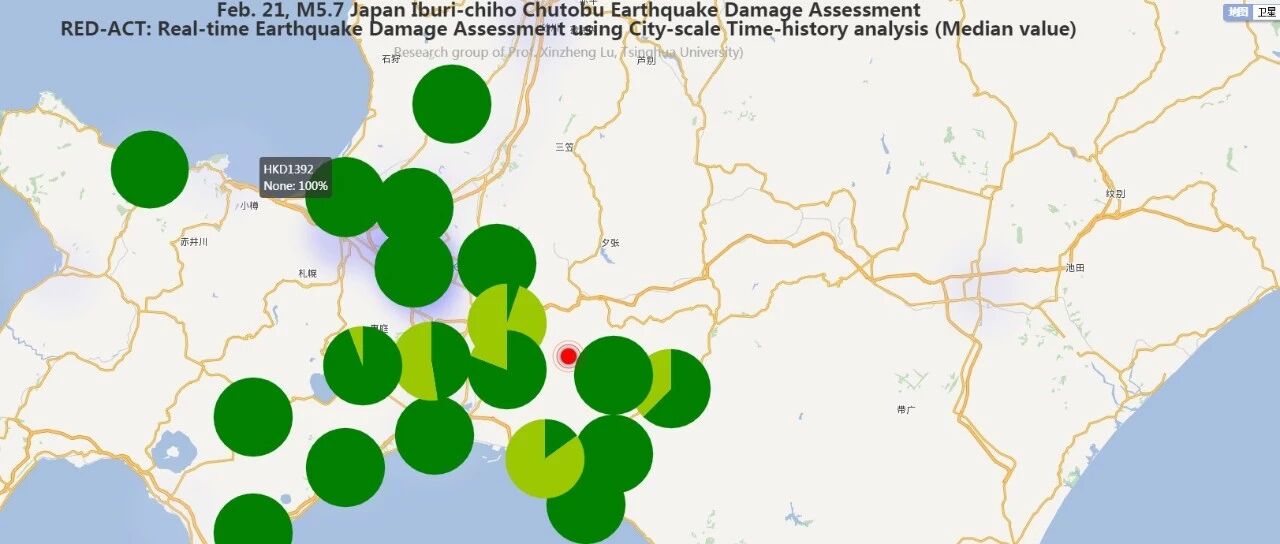
Using the real-time ground motions obtained from the strong motion networks and the city-scale nonlinear time-history analysis (see the Appendix of this report), the damage ratios of buildings located in different places can be obtained. The building damage distribution and the human uncomfortableness distribution near to different stations is shown in Figure 2 and Figure 3, respectively. These outcomes can provide a reference for post-earthquake rescue work.
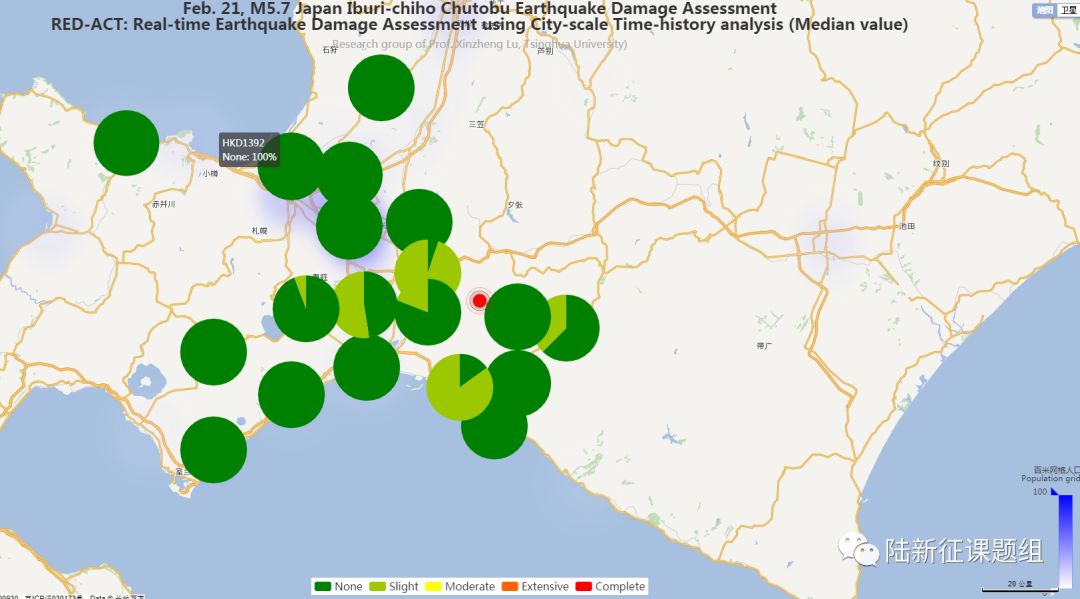
Figure 2 Damage ratio distribution of the buildings near to different stations
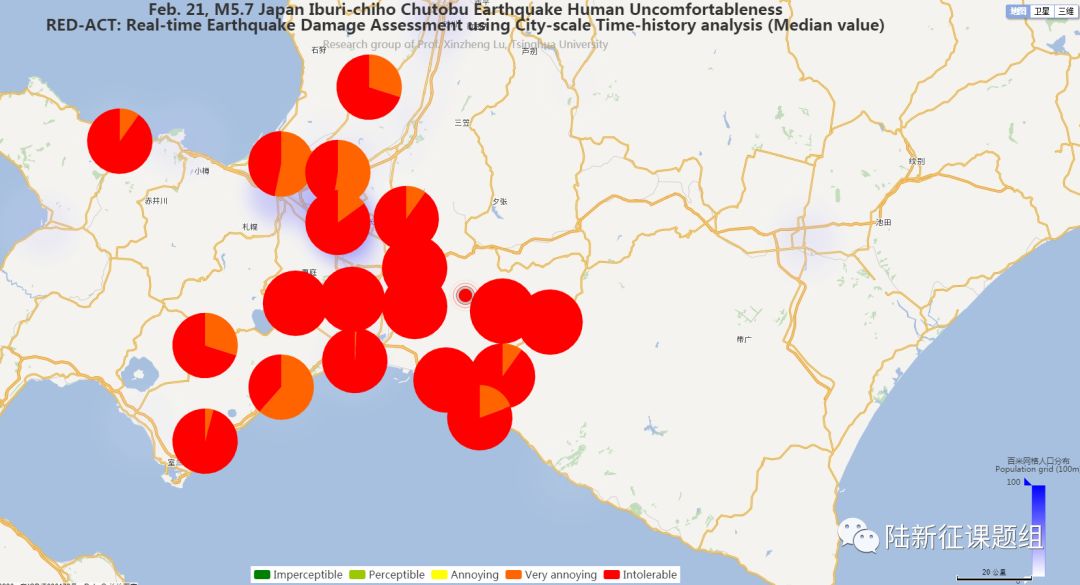
igure 3 Human uncomfortableness distribution near to different stations
The details can be accessed at
http://www.luxinzheng.net/software/2019-02-21-Japan-5.7.html
http://www.luxinzheng.net/software/2019-02-21-Japan-5.7-Acc.html
Table 1 Names and locations of the strong motion stations
No. Station Name Longitude Latitude
1 HKD103 142.297 42.7275
2 HKD104 142.131 42.5886
3 HKD105 142.054 42.4825
4 HKD120 141.663 43.3443
5 HKD124 141.79 42.9986
6 HKD125 142.135 42.7608
7 HKD126 141.928 42.575
8 HKD127 141.82 42.8741
9 HKD128 141.822 42.7655
10 HKD129 141.606 42.6344
11 HKD130 141.35 42.5627
12 HKD131 141.081 42.4211
13 HKD134 141.079 42.6711
14 HKD139 140.782 43.1974
15 HKD157 140.97 41.9051
16 HKD180 141.351 43.139
17 HKD181 141.546 43.1161
18 HKD182 141.552 42.9925
19 HKD184 141.601 42.79
20 HKD185 141.402 42.7755
------End------
相关研究
长按识别二维码,关注我们的科研动态