RED-ACT: Feb. 08, M4.1 Japan Shizuoka-ken Chubu Earthquake
RED-ACT Report
Real-time Earthquake Damage Assessment using City-scale Time-history analysis
Feb. 08, M4.1 Japan Shizuoka-ken Chubu Earthquake
Research group of Xinzheng Lu at Tsinghua University ([email protected])
First reported at 07:40, Feb. 08, 2019 (Beijing Time, UTC +8)
Acknowledgments and Disclaimer
The authors are grateful for the data provided by K-NET and KiK-net. This analysis is for research only. The actual damage resulting from the earthquake should be determined according to the site investigation.
1. Introduction to the earthquake event
At 06: 34, Feb. 08, 2019 (Local Time, UTC +9), an M 4.1 (JMA) earthquake occurred in Shizuoka-ken Chubu. The epicenter was located at 138.4E 35.2N, with a depth of 20.0 km.
2. Recorded ground motions
13 ground motions near to epicenter of this earthquake were analyzed. The names and locations of the stations can be found Table 1. The maximal recorded peak ground acceleration (PGA) is 65 cm/s/s. The corresponding response spectra in comparison with the design spectra specified in the Chinese Code for Seismic Design of Buildings are shown in Figure 1.
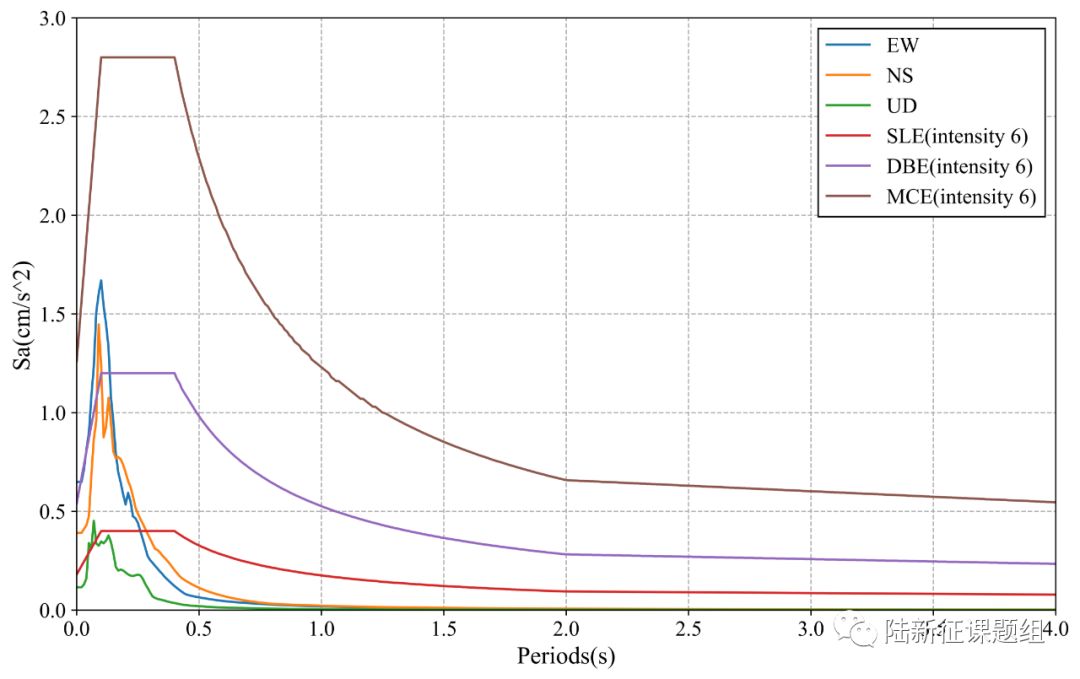
Figure 1 Response spectra of the recorded ground motions with maximal PGA
3. Damage analysis of the target region subjected to the recorded ground motions
Using the real-time ground motions obtained from the strong motion networks and the city-scale nonlinear time-history analysis (see the Appendix of this report), the damage ratios of buildings located in different places can be obtained. The building damage distribution and the human uncomfortableness distribution near to different stations is shown in Figure 2 and Figure 3, respectively. These outcomes can provide a reference for post-earthquake rescue work.
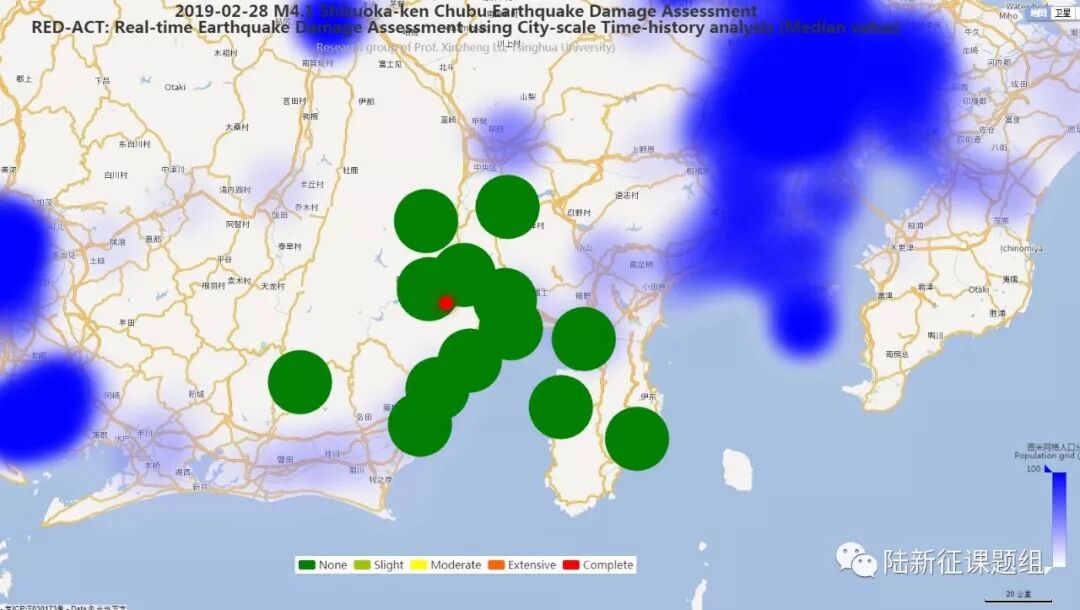
Figure 2 Damage ratio distribution of the buildings near to different stations
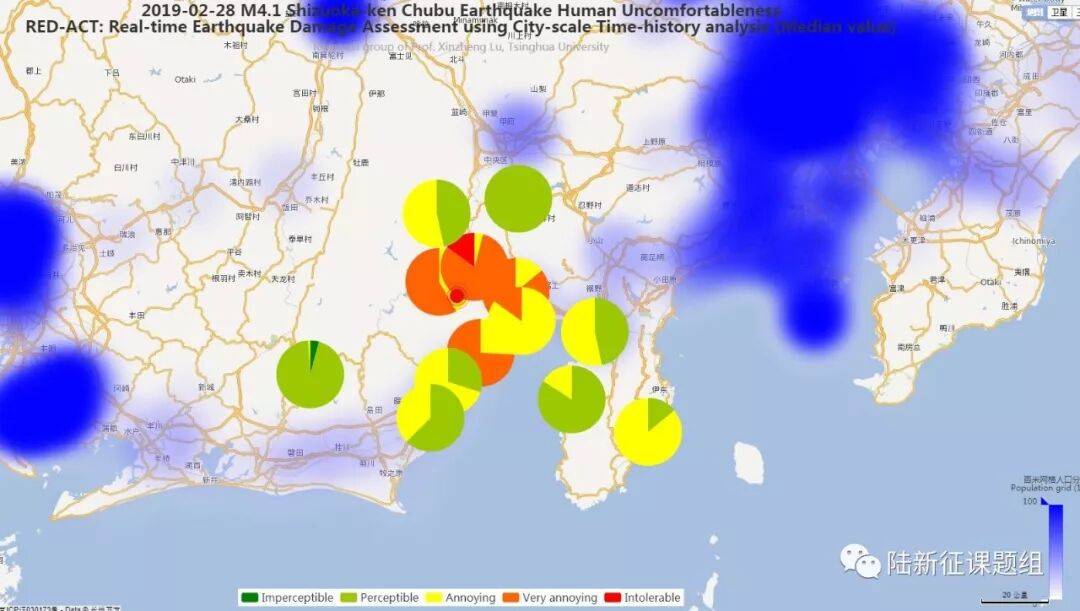
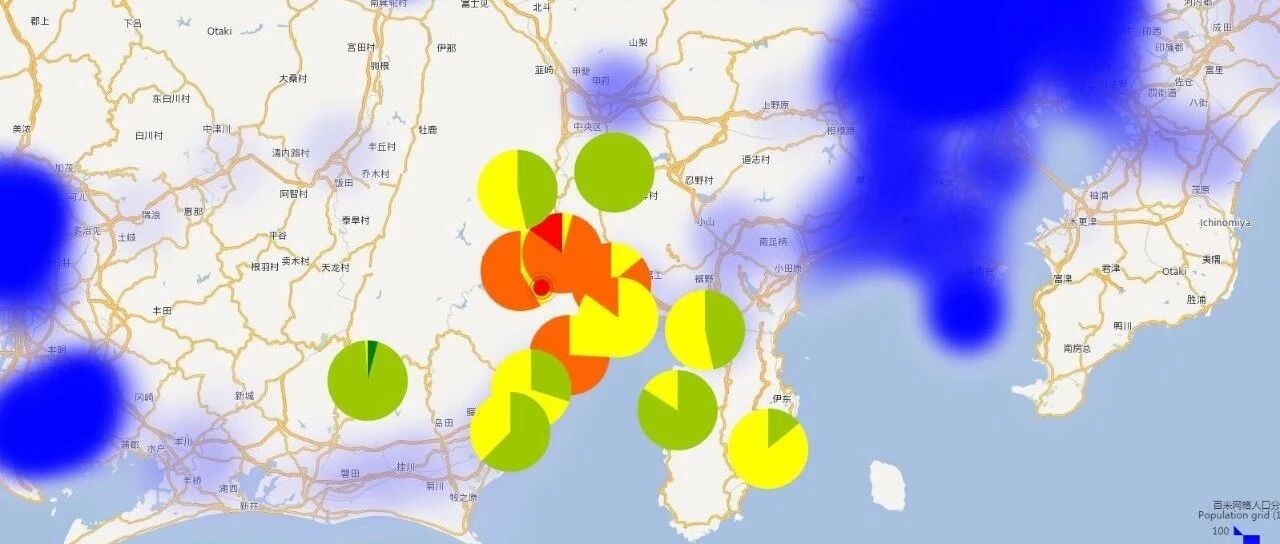
Figure 3 Human uncomfortableness distribution near to different stations
The details can be accessed at
http://www.luxinzheng.net/software/2019-02-28-Japan-4.1.html
http://www.luxinzheng.net/software/2019-02-28-Japan-4.1-Acc.html
Table 1 Names and locations of the strong motion stations
No. Station Name Longitude Latitude
1 SZO003 139.055 34.8158
2 SZO006 138.794 34.9113
3 SZO008 138.866 35.096
4 SZO011 138.602 35.2128
5 SZO012 138.621 35.1271
6 SZO013 138.476 35.041
7 SZO014 138.374 34.9649
8 SZO015 138.341 35.2435
9 SZO016 138.311 34.8566
10 SZO026 137.898 34.9816
11 YMN006 138.607 35.4684
12 YMN007 138.465 35.2791
13 YMN008 138.332 35.432
----End-----
相关研究
长按识别二维码,关注我们的科研动态