RED-ACT: 6月24日日本千叶县5.5级地震破坏力分析
RED-ACT Report
Real-time Earthquake Damage Assessment using City-scale Time-history analysis
June 24, M5.5 Japan Chiba-ken Earthquake
Research group of Xinzheng Lu at Tsinghua University ([email protected])
First reported at 08:20, June 24, 2019 (Beijing Time, UTC +8)
Acknowledgments and Disclaimer
The authors are grateful for the data provided by K-NET and KiK-net. This analysis is for research only. The actual damage resulting from the earthquake should be determined according to the site investigation.
Scientific background of this report can be found at:
http://www.luxinzheng.net/rr.htm
1. Introduction to the earthquake event
At 09:11 24 Jun 2019 (Local Time, UTC +9), an M 5.5 (JMA) earthquake occurred in Japan Chiba-ken. The epicenter was located at 140.0 34.9, with a depth of 60.0 km.
2. Recorded ground motions
20 ground motions near to epicenter of this earthquake were analyzed. The names and locations of the stations can be found Table 1. The maximal recorded peak ground acceleration (PGA) is 107 cm/s/s. The corresponding response spectra in comparison with the design spectra specified in the Chinese Code for Seismic Design of Buildings are shown in Figure 1.
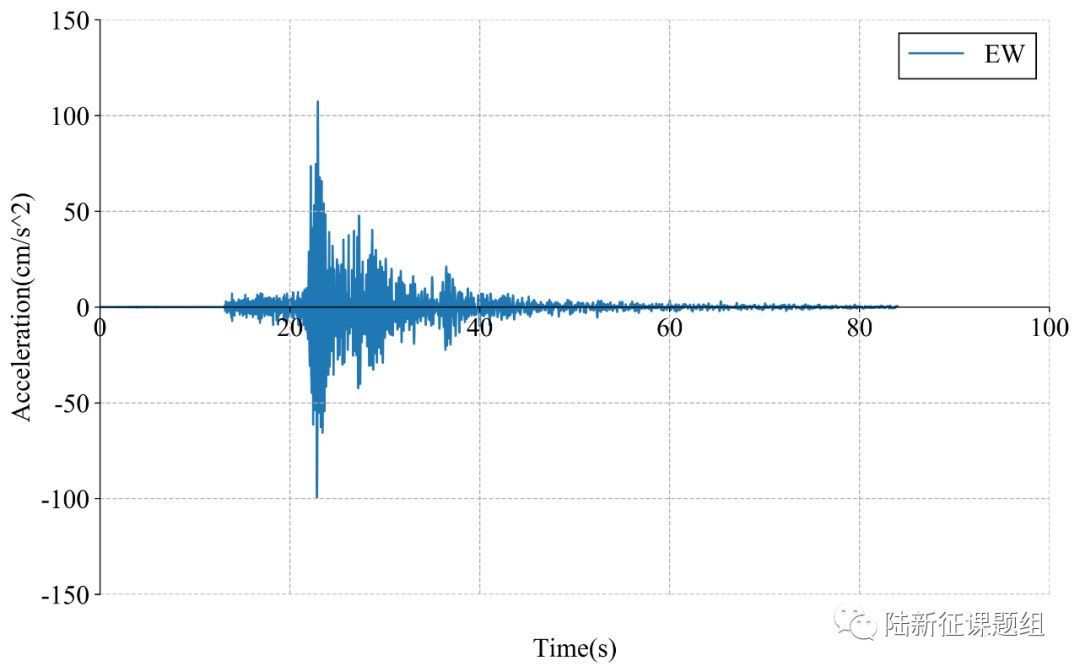
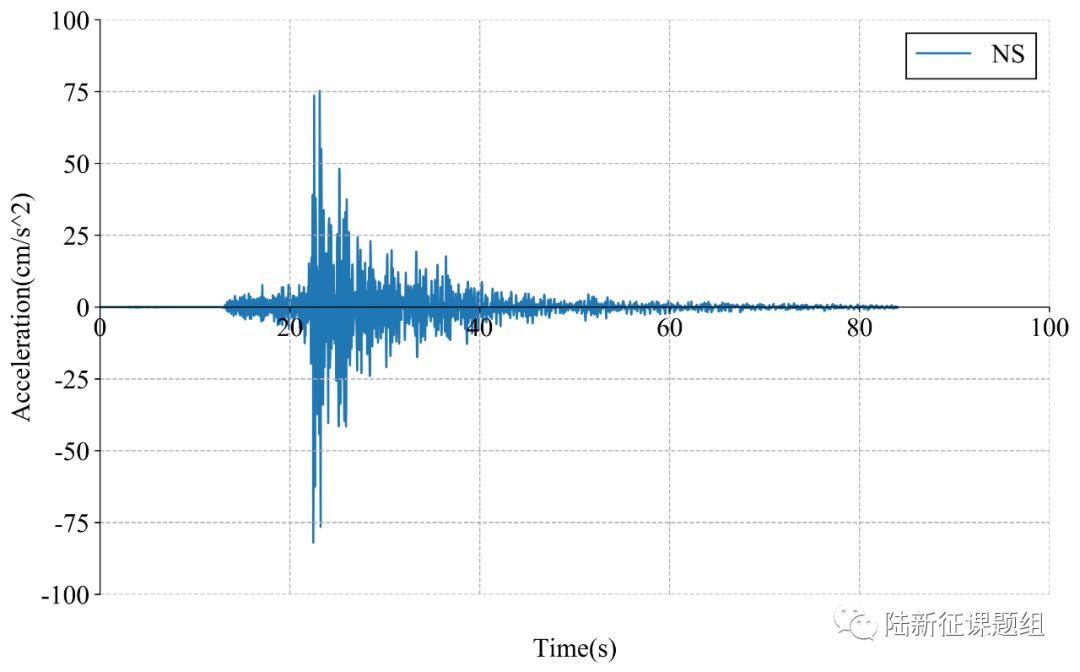
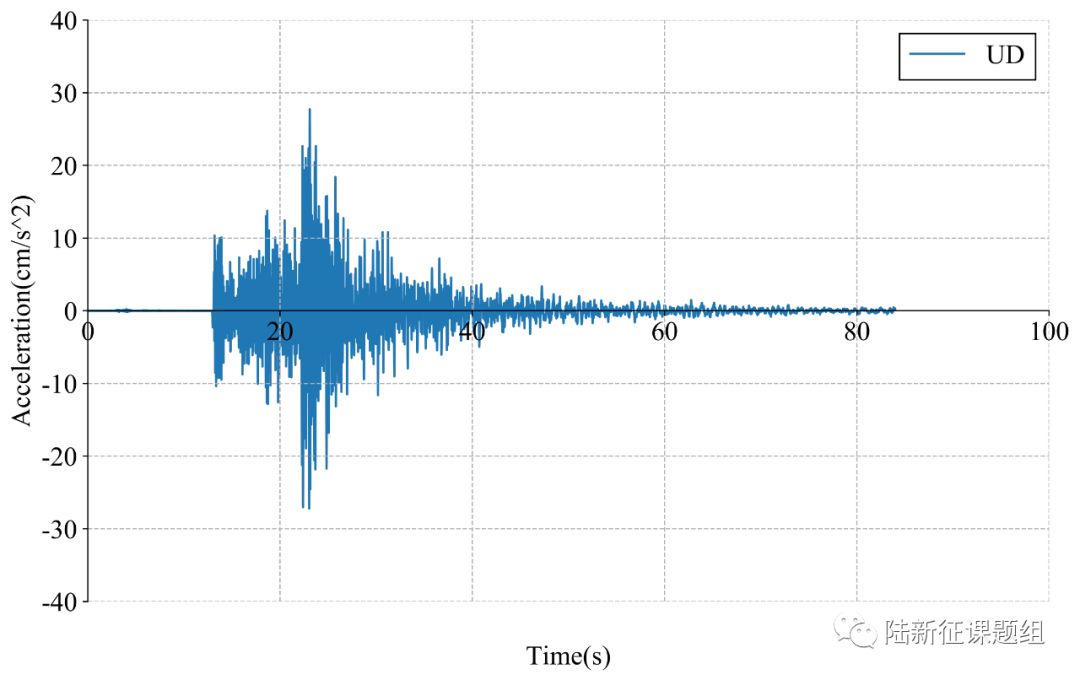
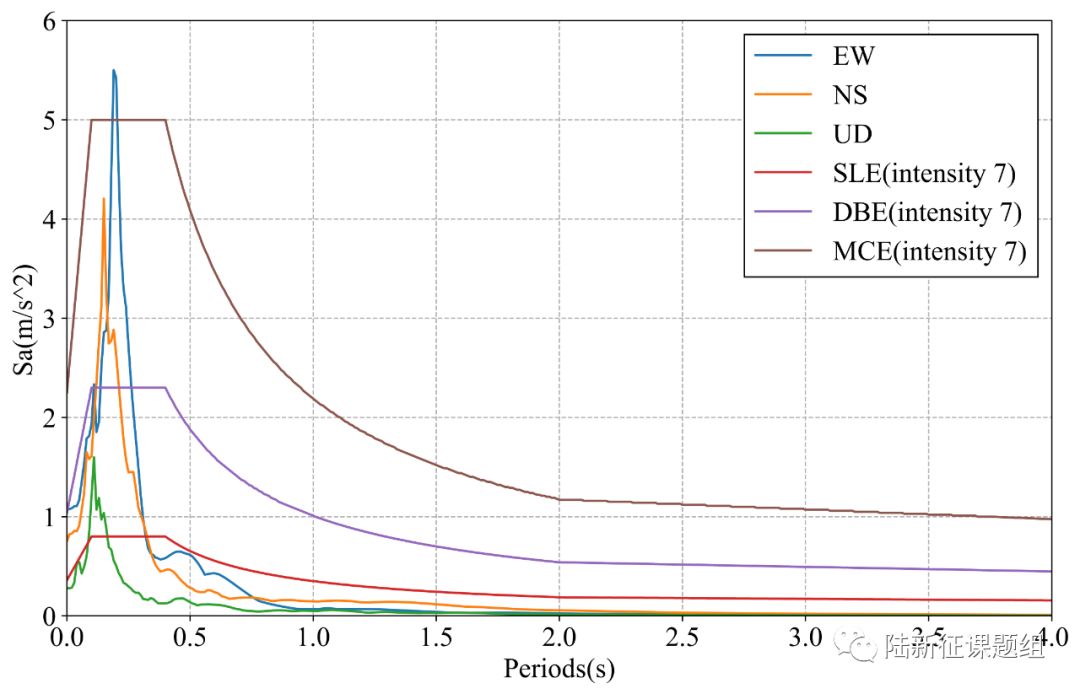
Figure 1 Response spectra of the recorded ground motions with maximal PGA
3. Damage analysis of the target region subjected to the recorded ground motions
Using the real-time ground motions obtained from the strong motion networks and the city-scale nonlinear time-history analysis (see the Appendix of this report), the damage ratios of buildings located in different places can be obtained. The building damage distribution and the human uncomfortableness distribution near to different stations is shown in Figure 2 and Figure 3, respectively. These outcomes can provide a reference for post-earthquake rescue work.
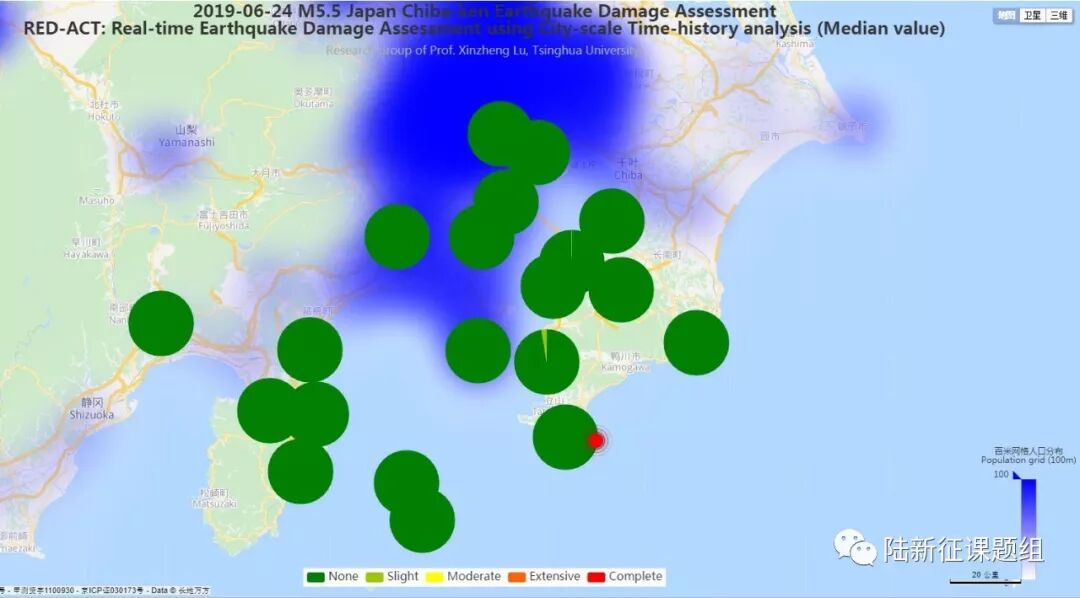
Figure 2 Damage ratio distribution of the buildings near to different stations
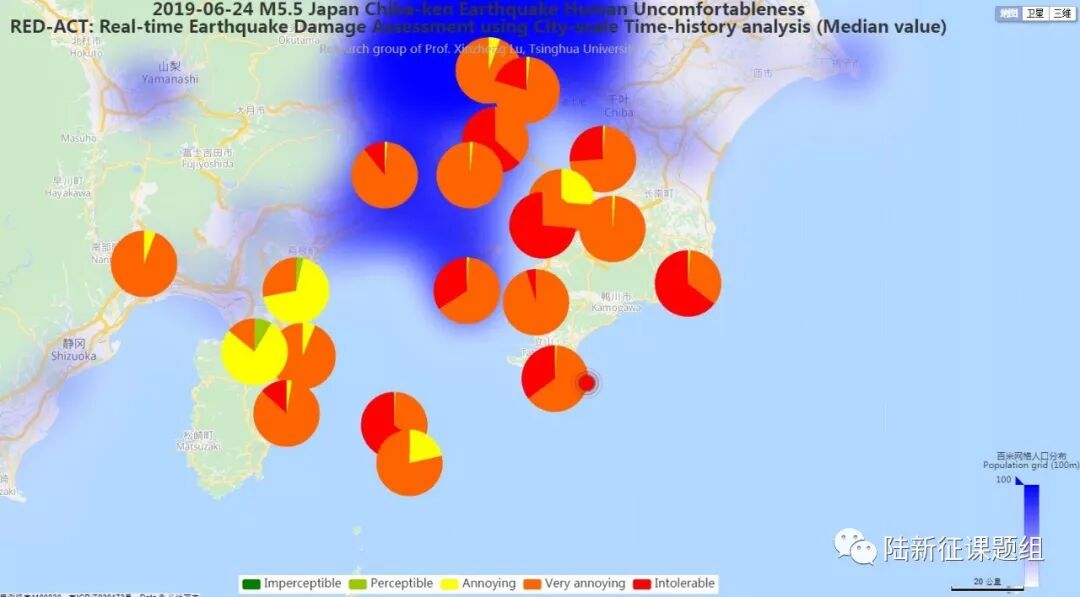
Figure 3 Human uncomfortableness distribution near to different stations
4. Earthquake-induced landslide of the target region subjected to the recorded ground motions
According to local topographic data, lithology data and ground motion records, the distribution of earthquake-induced landslide near to different stations under the different proportions of the landslide slab thickness that is saturated can be calculated, as shown in Figure 4. The basemap shows the distribution of the local slope. The number in the circle represents the critical slope of the landslide. The earthquake-induced landslide tends to occur with a higher probability when the slope near the station is larger than this threshold value.
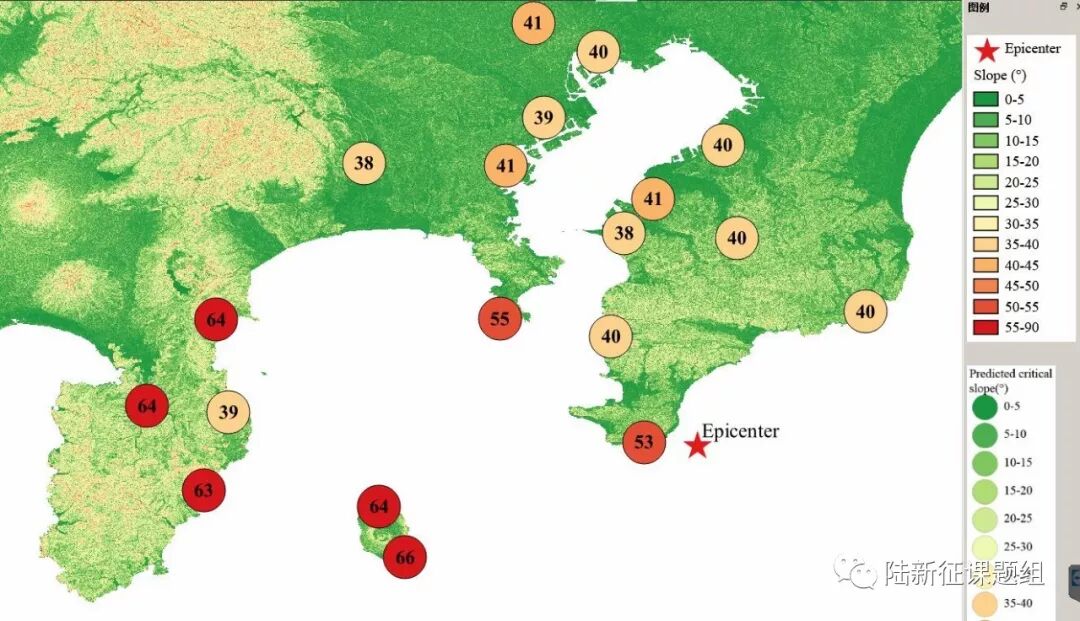
(a) The proportion of the landslide slab thickness that is saturated equals 0%
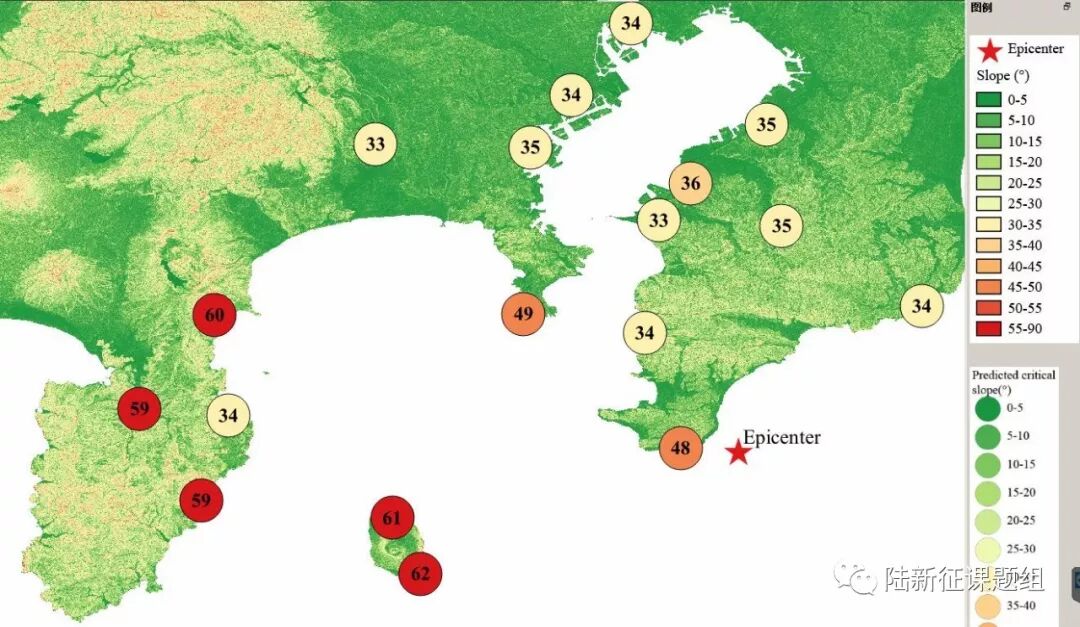
(b) The proportion of the landslide slab thickness that is saturated equals 50%
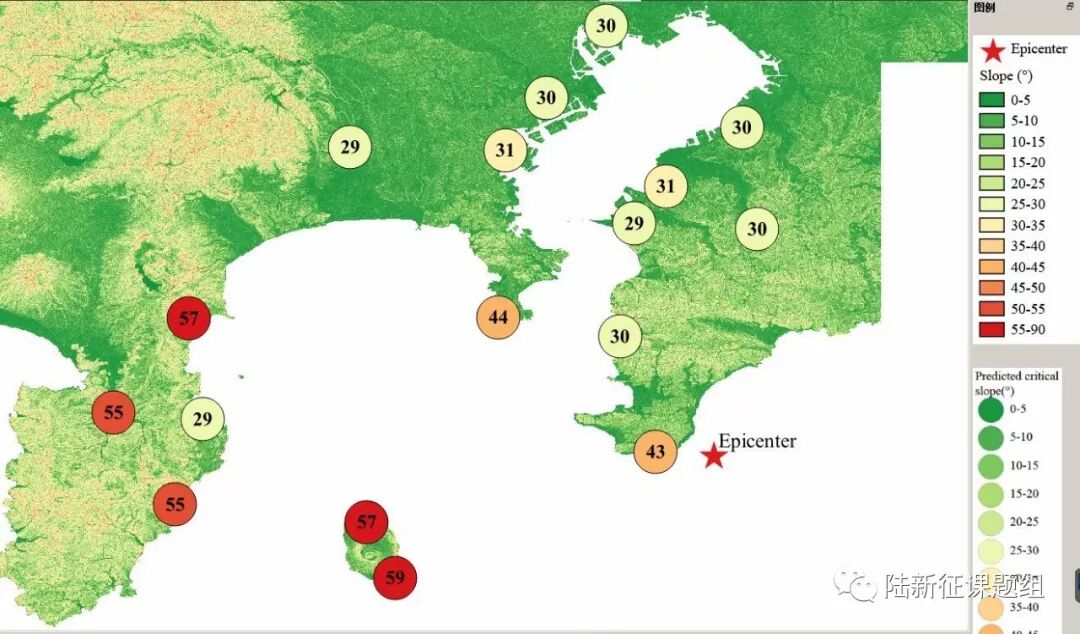
(c) The proportion of the landslide slab thickness that is saturated equals 90%
Figure 4 Distribution of earthquake-induced landslide near to different stations
Scientific background of this report can be found at: http://www.luxinzheng.net/rr.htm
Table 1 Names and locations of the strong motion stations
No. Station Name Longitude Latitude
1 CHB014 140.049 35.4769
2 CHB015 139.916 35.3738
3 CHB017 140.076 35.2988
4 CHB018 140.322 35.1577
5 CHB019 139.835 35.1105
6 CHB021 139.898 34.9083
7 CHB022 139.86 35.3083
8 KNG001 139.706 35.5291
9 KNG002 139.634 35.4371
10 KNG004 139.622 35.1441
11 KNG009 139.362 35.4424
12 SZO001 139.079 35.1424
13 SZO002 139.103 34.9652
14 SZO003 139.055 34.8158
15 SZO007 138.947 34.9771
16 SZO011 138.602 35.2128
17 TKY007 139.686 35.7107
18 TKY008 139.391 34.7852
19 TKY009 139.441 34.6874
20 TKY018 139.811 35.6551
---End---
相关研究
长按识别二维码,关注我们的科研动态