RED-ACT: 6月18日,日本6.8级地震破坏力分析
RED-ACT Report
Real-time Earthquake Damage Assessment using City-scale Time-history analysis
June 18, M6.8 Japan Yamagata-ken Oki Earthquake
Research group of Xinzheng Lu at Tsinghua University ([email protected])
First reported at 21:45, June 18, 2019 (Beijing Time, UTC +8)
Acknowledgments and Disclaimer
The authors are grateful for the data provided by K-NET and KiK-net. This analysis is for research only. The actual damage resulting from the earthquake should be determined according to the site investigation.
Scientific background of this report can be found at:
http://www.luxinzheng.net/software/Real-Time_Report.pdf
1. Introduction to the earthquake event
At 22:22 JST 18 Jun 2019 (Local Time, UTC +9), an M 6.8 (JMA) earthquake occurred in Japan Yamagata-ken Oki. The epicenter was located at 139.5 38.6, with a depth of 10.0 km.
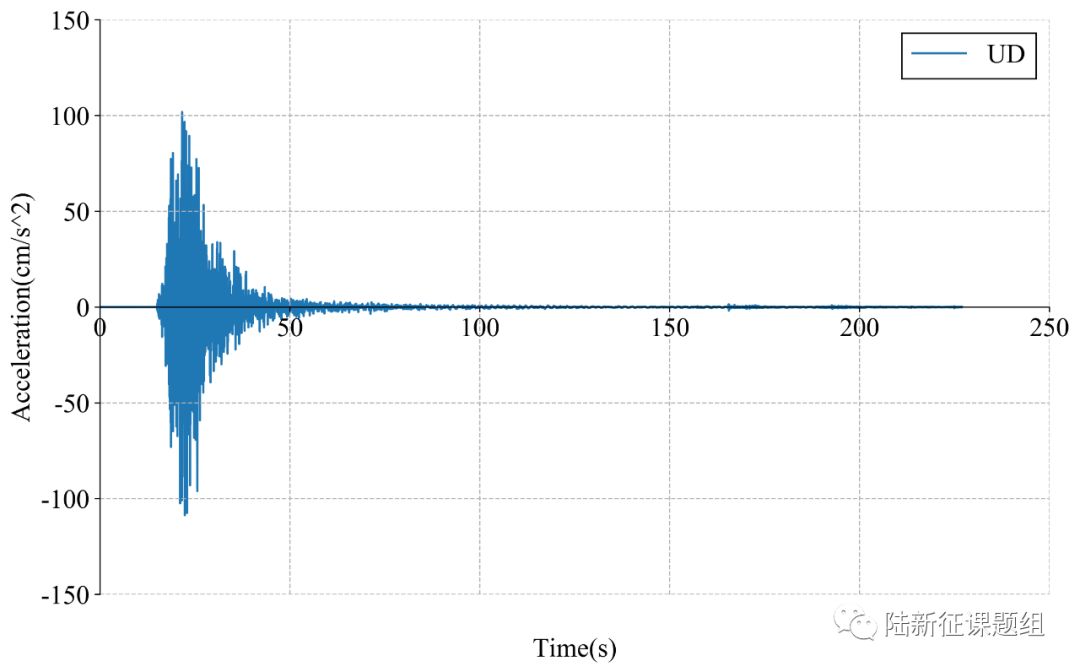
2. Recorded ground motions
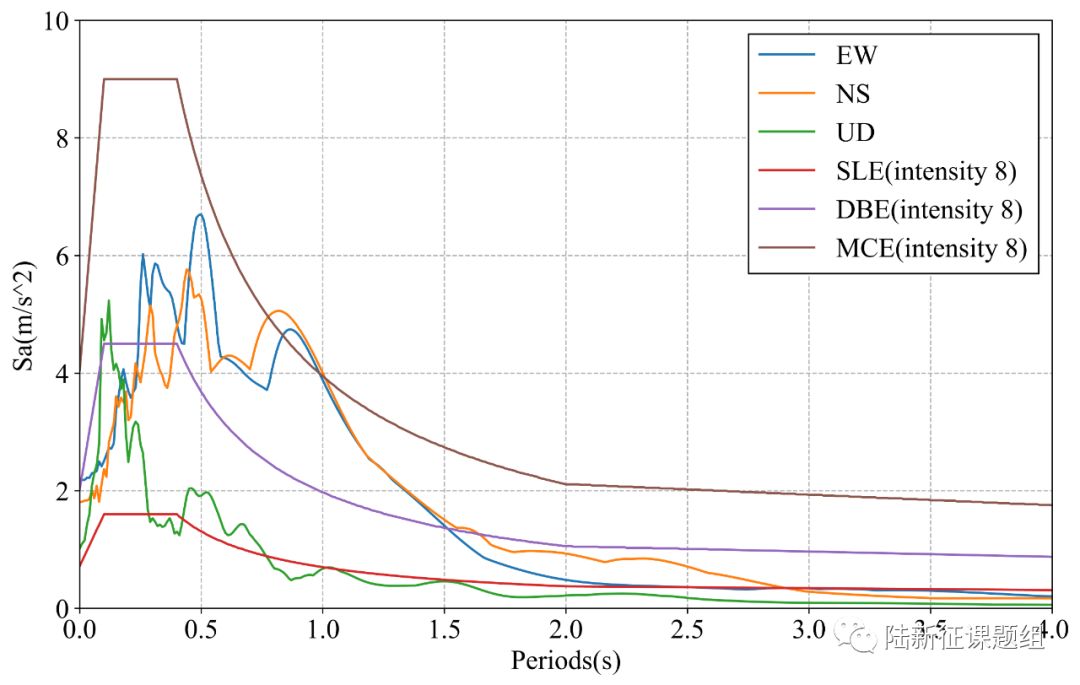
25 ground motions near to epicenter of this earthquake were analyzed. The names and locations of the stations can be found in Table 1. The maximal recorded peak ground acceleration (PGA) is 331 cm/s/s. The corresponding response spectra in comparison with the design spectra specified in the Chinese Code for Seismic Design of Buildings are shown in Figure 1.

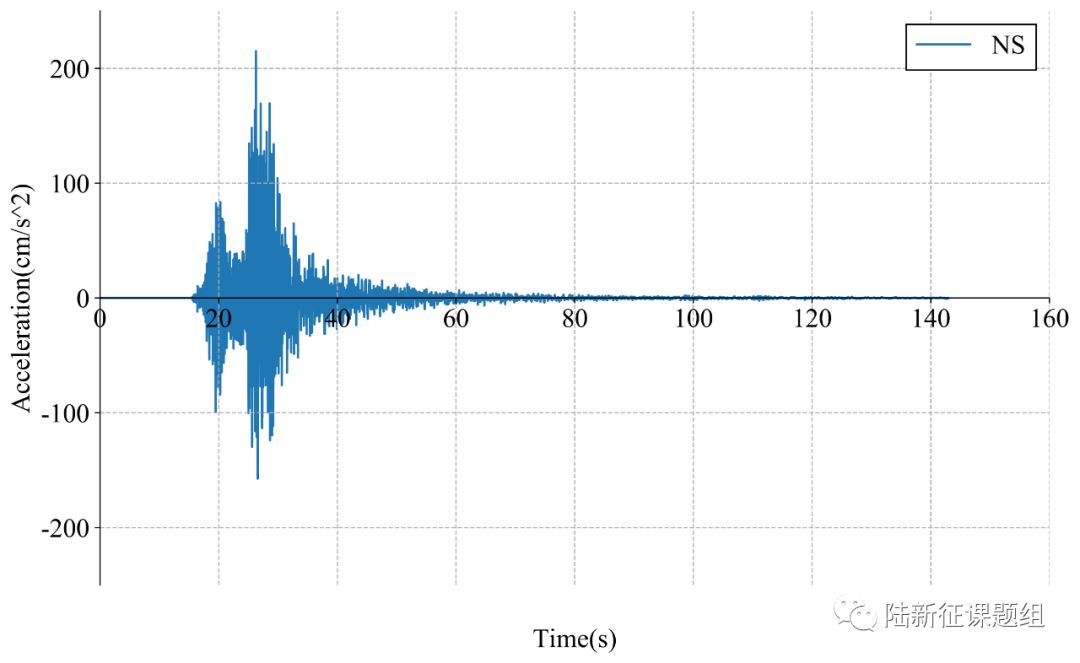
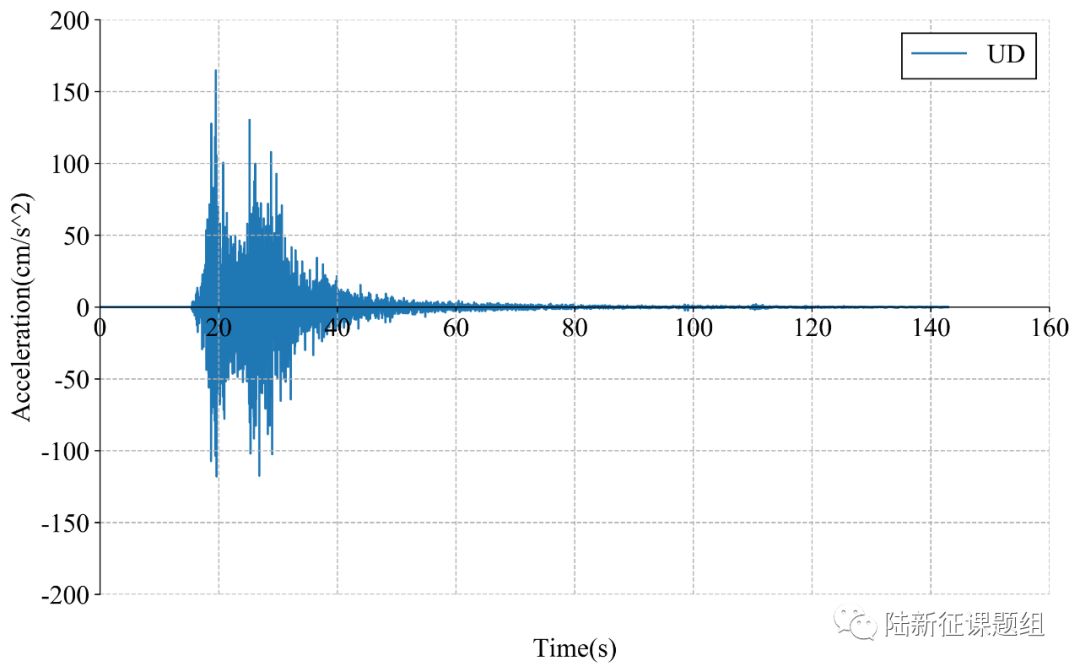

(a) YMT005
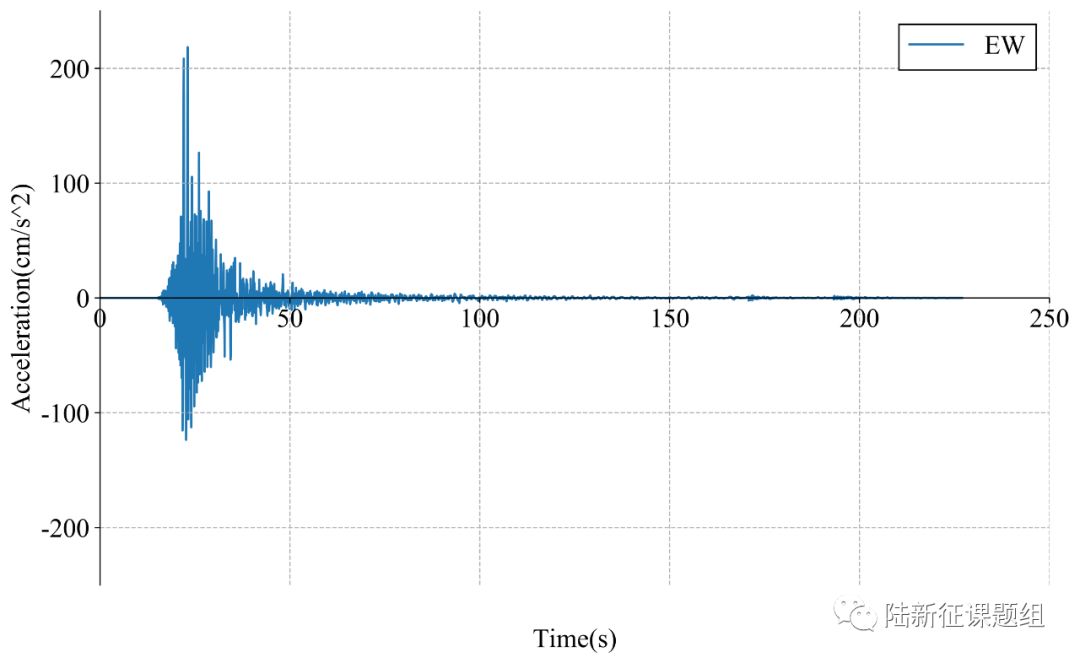
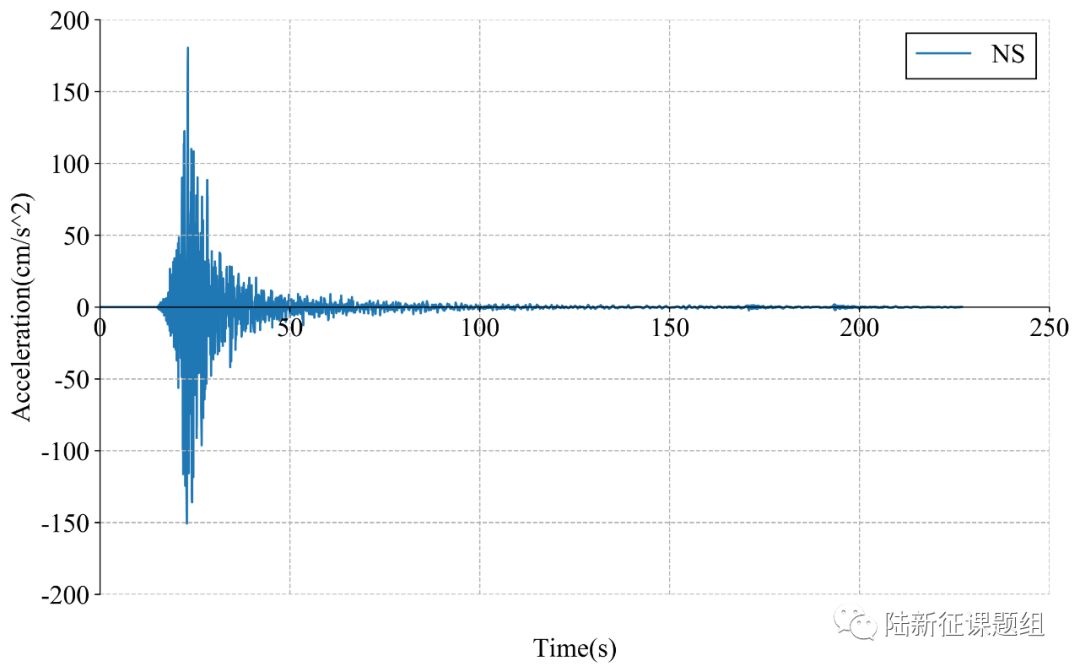
(b) YMT003
Figure 1 Response spectra of the recorded ground motions
3. Damage analysis of the target region subjected to the recorded ground motions
Using the real-time ground motions obtained from the strong motion networks and the city-scale nonlinear time-history analysis (see the Appendix of this report), the damage ratios of buildings located in different places can be obtained. The building damage distribution and the human uncomfortableness distribution near to different stations are shown in Figure 2 and Figure 3, respectively. These outcomes can provide a reference for post-earthquake rescue work.
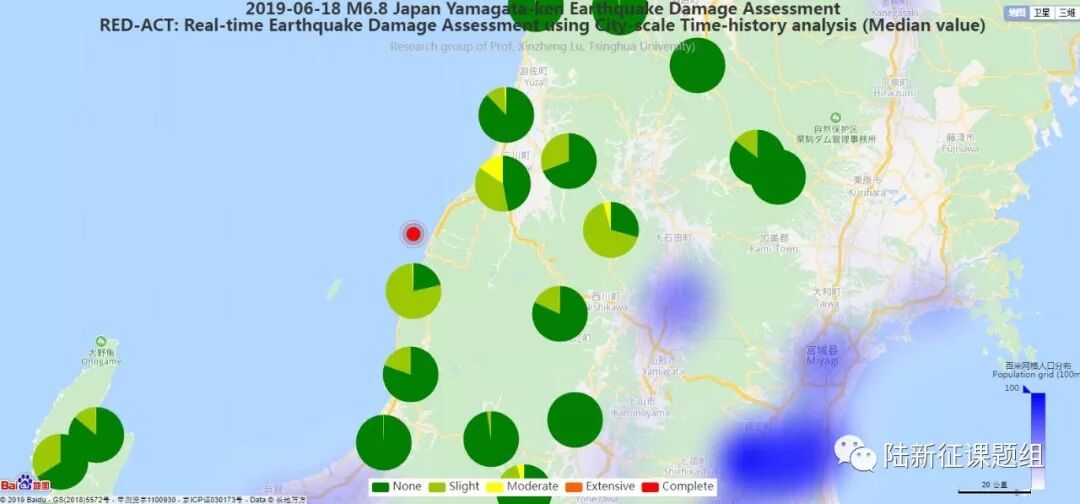
Figure 2 Damage ratio distribution of the buildings near to different stations
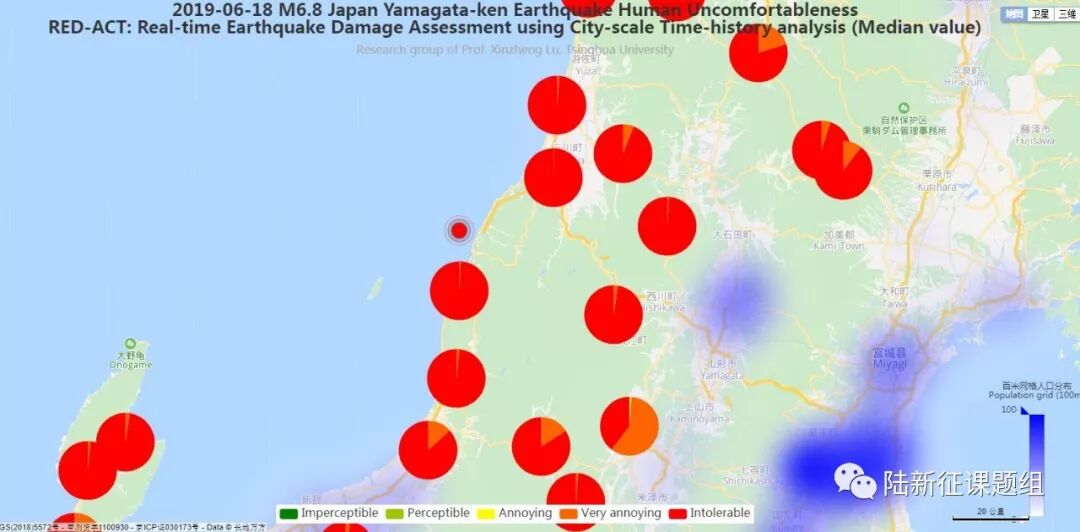
Figure 3 Human uncomfortableness distribution near to different stations
4. Earthquake-induced landslide of the target region subjected to the recorded ground motions
According to local topographic data, lithology data and ground motion records, the distribution of earthquake-induced landslide near to different stations under the different proportions of the landslide slab thickness that is saturated can be calculated, as shown in Figure 4. The basemap shows the distribution of the local slope. The number in the circle represents the critical slope of the landslide. The earthquake-induced landslide tends to occur with a higher probability when the slope near the station is larger than this threshold value.
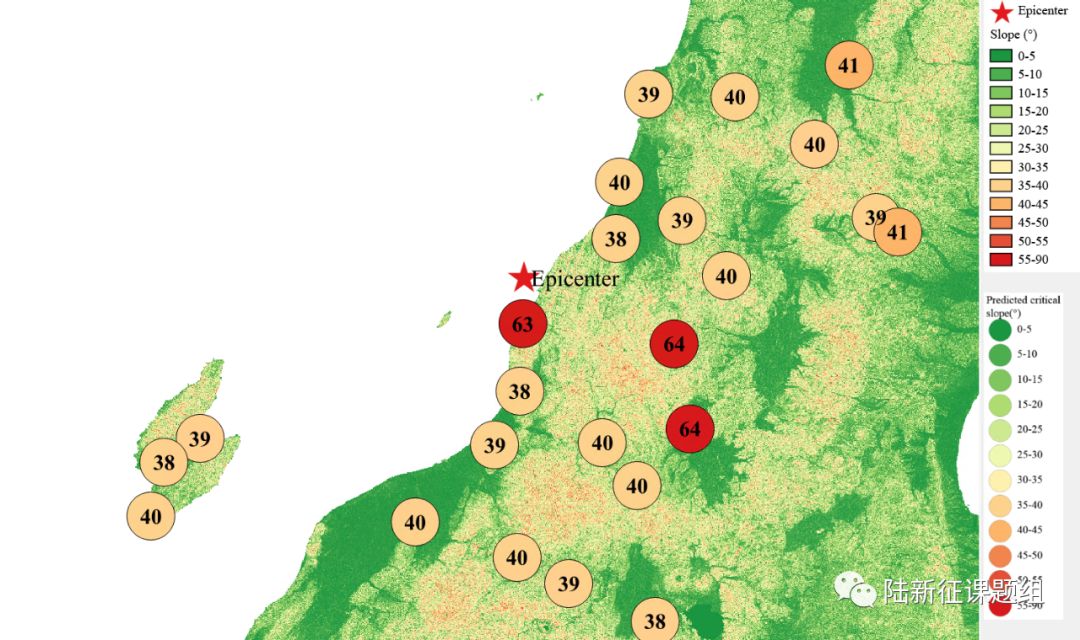
(a) The proportion of the landslide slab thickness that is saturated equals 0%
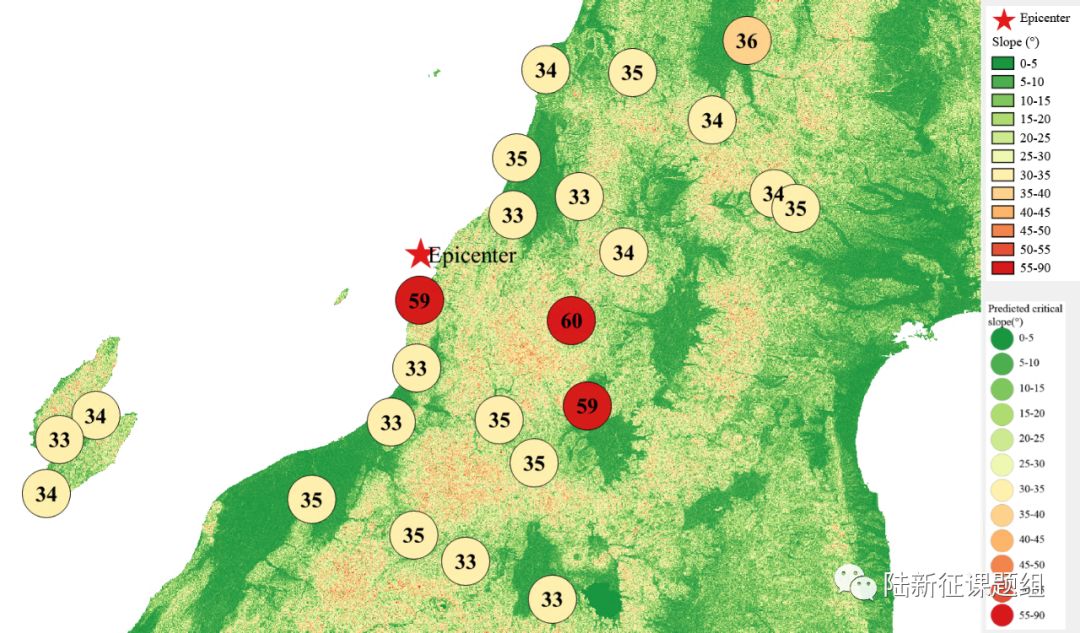
(b) The proportion of the landslide slab thickness that is saturated equals 50%
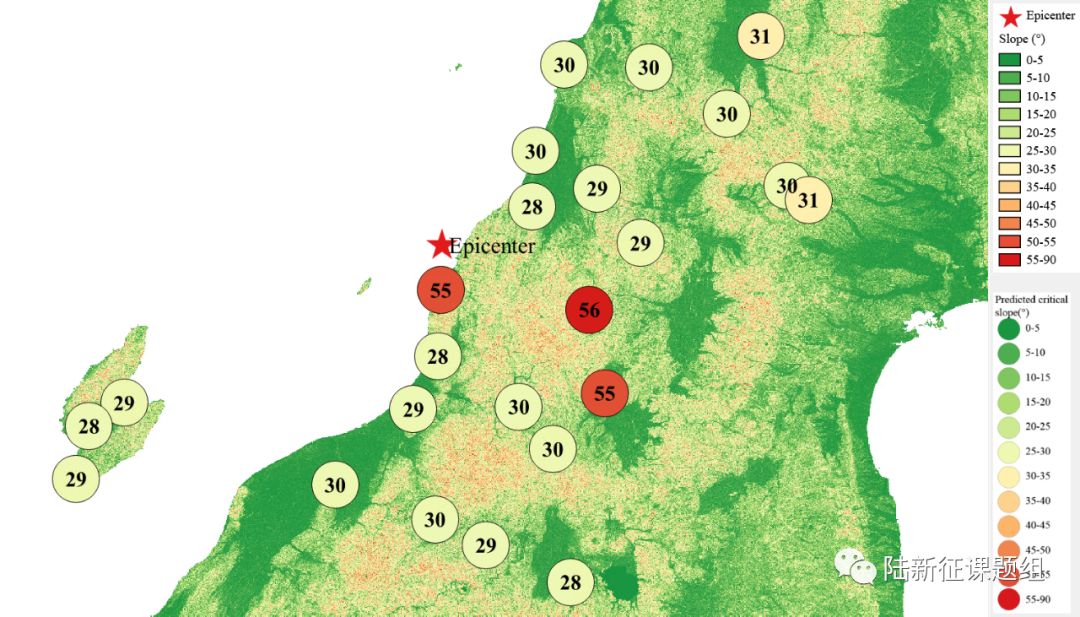
(c) The proportion of the landslide slab thickness that is saturated equals 90%
Figure 4 Distribution of earthquake-induced landslide near to different stations
Scientific background of this report can be found at: http://www.luxinzheng.net/software/Real-Time_Report.pdf
Table 1 Names and locations of the strong motion stations
No. Station Name Longitude Latitude
1 AKT011 140.58 39.8128
2 AKT017 140.563 39.2975
3 AKT018 140.19 39.1939
4 AKT019 140.451 39.0384
5 AKT020 139.909 39.2022
6 FKS022 139.647 37.6002
7 FKS023 139.929 37.4774
8 MYG005 140.651 38.7992
9 MYG019 140.723 38.7513
10 NIG002 138.44 38.0745
11 NIG003 138.323 37.9976
12 NIG004 138.28 37.8205
13 NIG006 139.496 38.4501
14 NIG007 139.486 38.2301
15 NIG008 139.405 38.053
16 NIG011 139.144 37.8013
17 NIG012 139.477 37.6863
18 YMT001 139.813 38.914
19 YMT003 139.801 38.7292
20 YMT005 140.162 38.607
21 YMT008 139.992 38.3856
22 YMT012 140.043 38.1074
23 YMT013 139.757 38.0621
24 YMT014 139.87 37.9207
25 YMT016 140.018 38.7895


程庆乐
---End---
相关研究
长按识别二维码,关注我们的科研动态