RED-ACT: 0604 M6.1 Japan Torishima Kinkai Earthquake
RED-ACT Report
Real-time Earthquake Damage Assessment using City-scale Time-history analysis
June 04, M6.1 Japan Torishima Kinkai Earthquake
Research group of Xinzheng Lu at Tsinghua University ([email protected])
First reported at 16:00, June 04, 2019 (Beijing Time, UTC +8)
Acknowledgments and Disclaimer
The authors are grateful for the data provided by K-NET and KiK-net. This analysis is for research only. The actual damage resulting from the earthquake should be determined according to the site investigation.
Scientific background of this report can be found at:
http://www.luxinzheng.net/software/Real-Time_Report.pdf
1. Introduction to the earthquake event
At 13:40 04 Jun 2019 (Local Time, UTC +9), an M 6.1 (JMA) earthquake occurred in Japan Torishima Kinka. The epicenter was located at 139.8 29.1, with a depth of 440.0 km.
2. Recorded ground motions
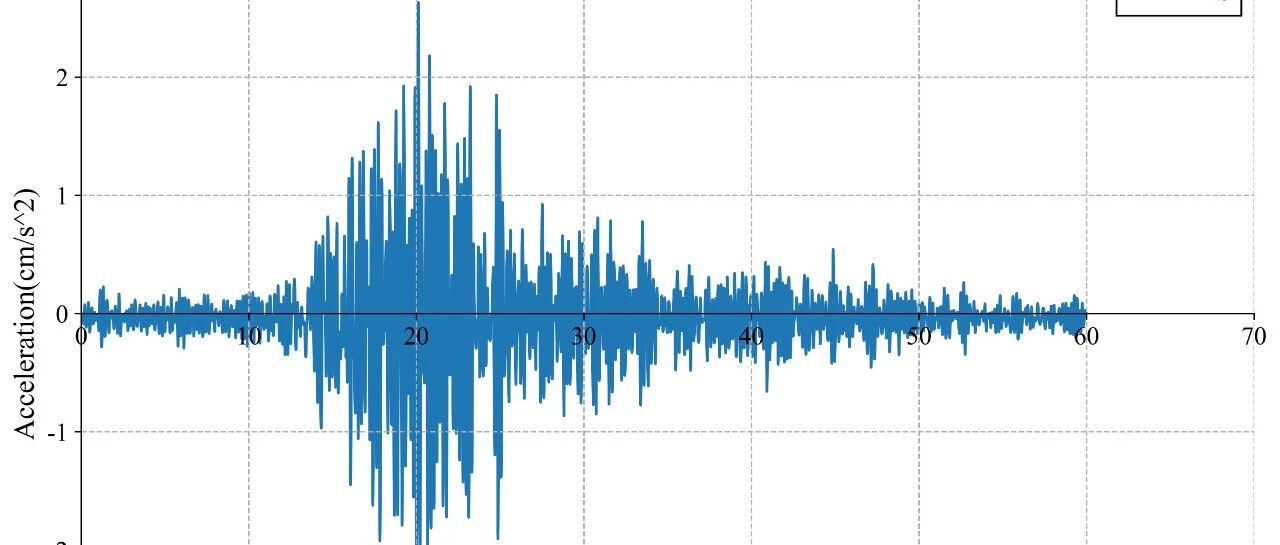
13 ground motions near to epicenter of this earthquake were analyzed. The names and locations of the stations can be found Table 1. The maximal recorded peak ground acceleration (PGA) is 2.6 cm/s/s. The corresponding response spectra in comparison with the design spectra specified in the Chinese Code for Seismic Design of Buildings are shown in Figure 1.
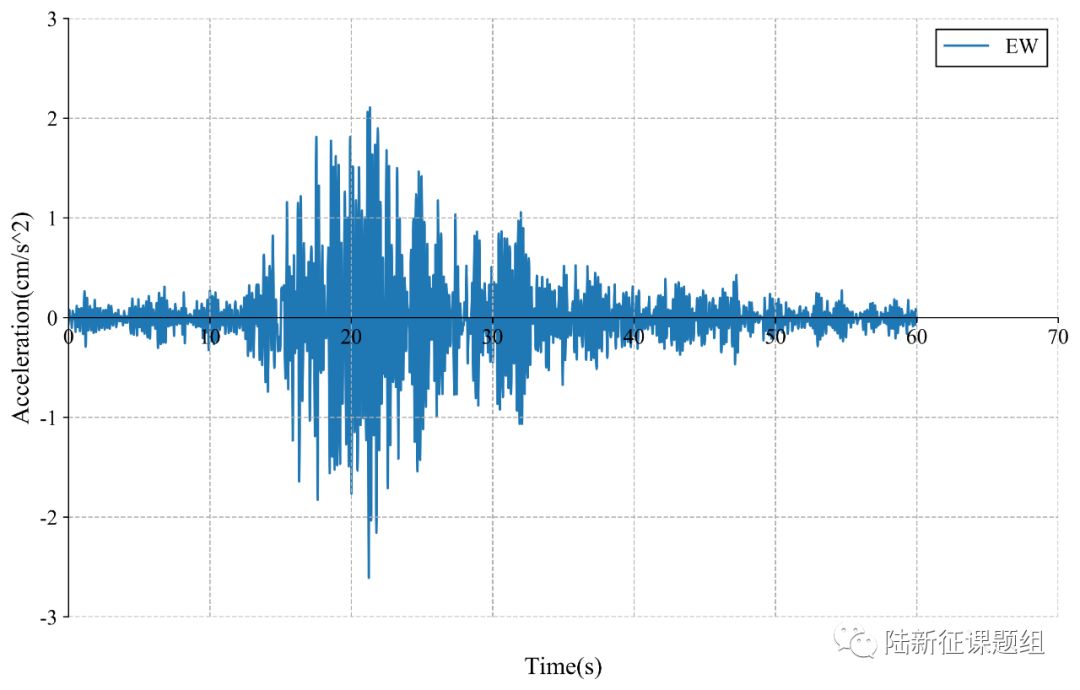
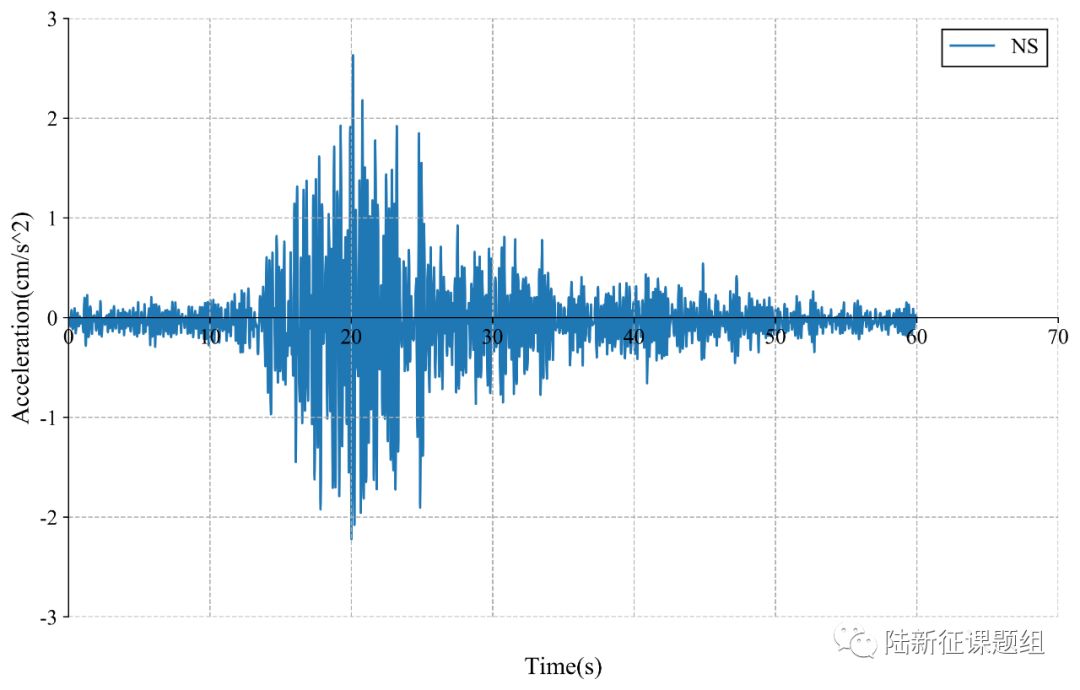
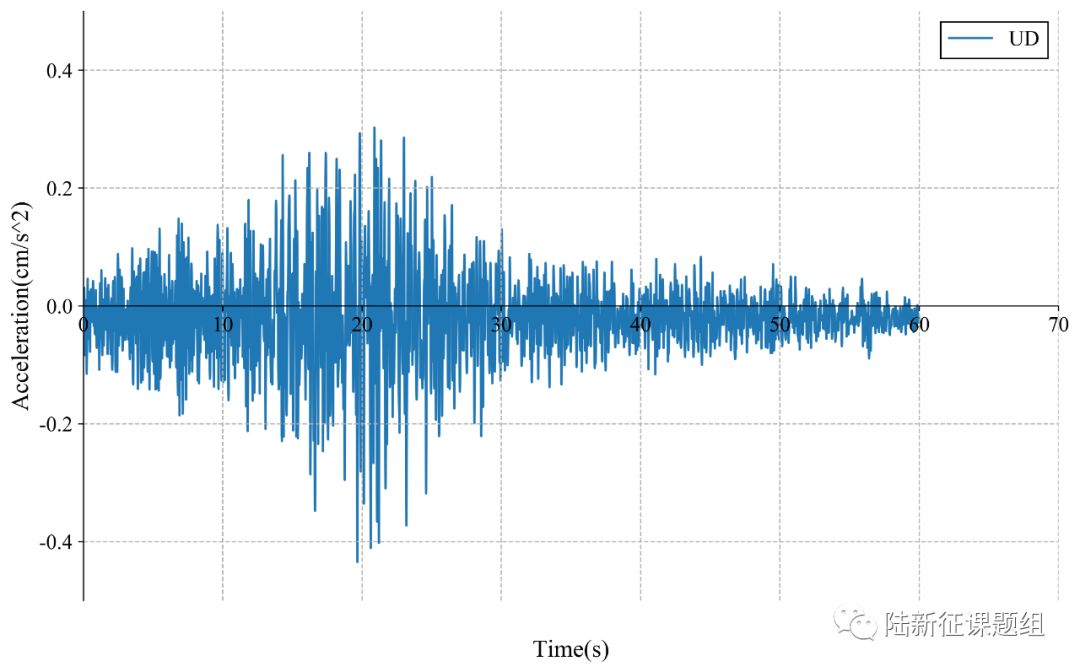
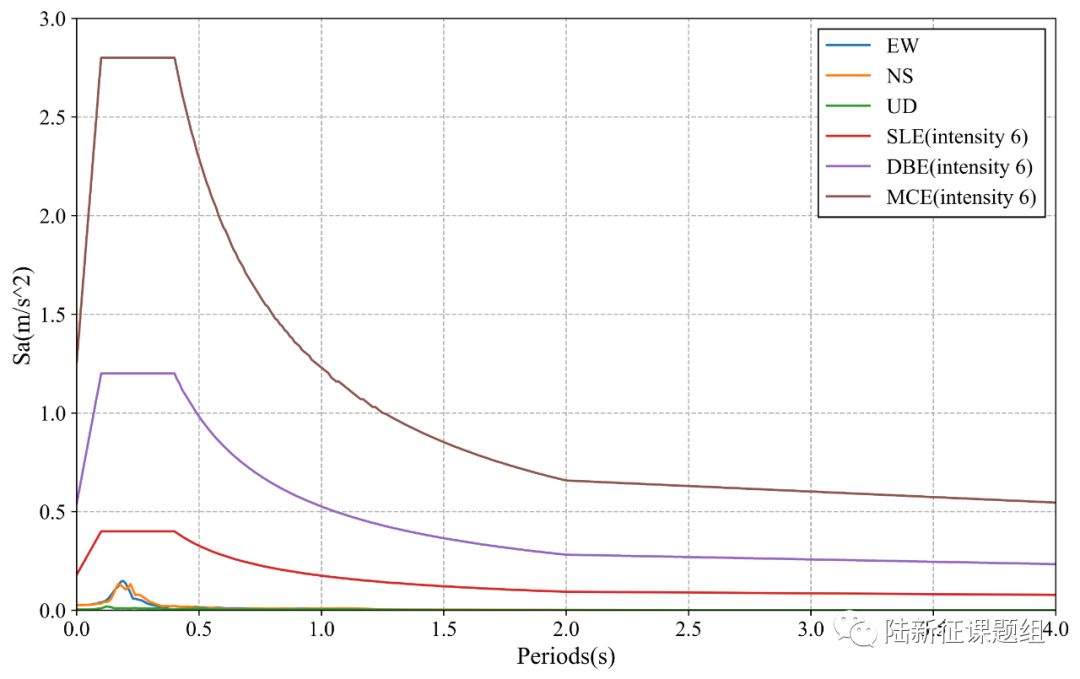
Figure 1 Response spectra of the recorded ground motions with maximal PGA
3. Damage analysis of the target region subjected to the recorded ground motions
Using the real-time ground motions obtained from the strong motion networks and the city-scale nonlinear time-history analysis (see the Appendix of this report), the damage ratios of buildings located in different places can be obtained. The building damage distribution and the human uncomfortableness distribution near to different stations is shown in Figure 2 and Figure 3, respectively. These outcomes can provide a reference for post-earthquake rescue work.
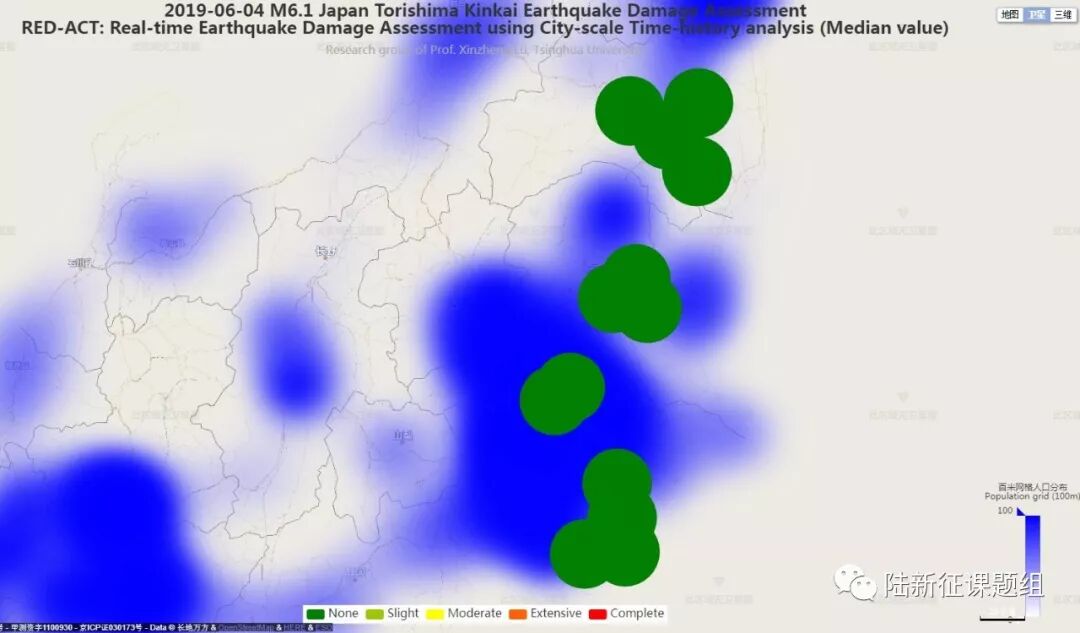
Figure 2 Damage ratio distribution of the buildings near to different stations
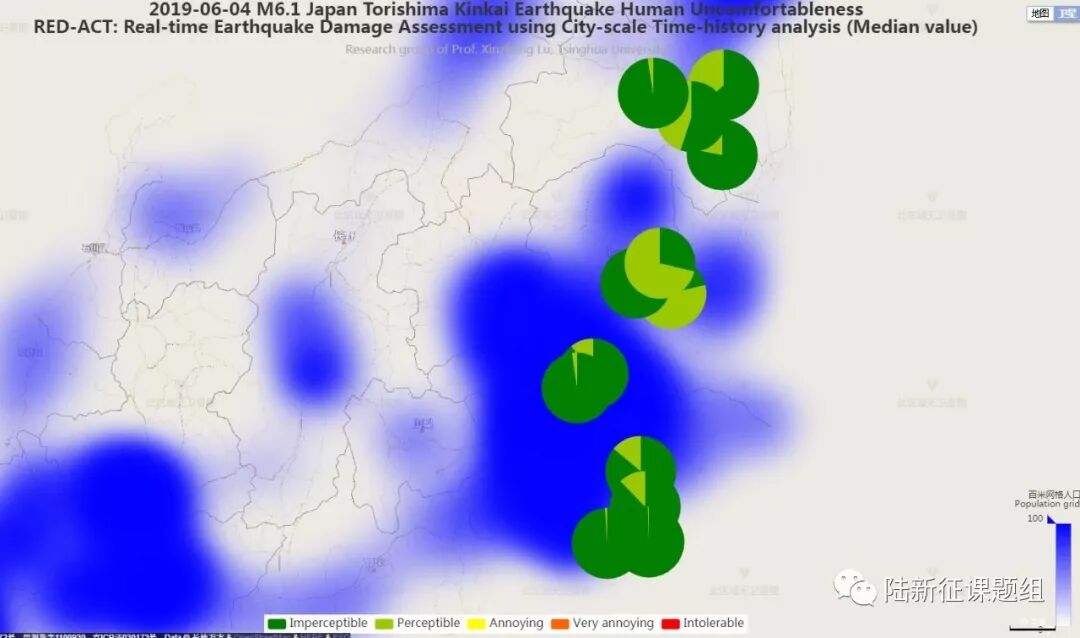
Figure 3 Human uncomfortableness distribution near to different stations
Scientific background of this report can be found at: http://www.luxinzheng.net/software/Real-Time_Report.pdf
Table 1 Names and locations of the strong motion stations
No. Station Name Longitude Latitude
1 CHB014 140.049 35.4769
2 CHB017 140.076 35.2988
3 CHB019 139.835 35.1105
4 CHB020 140.102 35.1155
5 FKS008 140.567 37.4363
6 FKS013 140.556 37.09
7 FKS017 140.369 37.2842
8 FKS024 140.132 37.3957
9 IBR005 140.237 36.3851
10 SIT008 139.746 35.9829
11 SIT010 139.648 35.9065
12 TCG013 140.023 36.4368
13 TCG014 140.174 36.545
---End---
相关研究
长按识别二维码,关注我们的科研动态