RED-ACT Report: 05-05 M5.3 Japan Nemuro-hanto Earthquake
RED-ACT Report
Real-time Earthquake Damage Assessment using City-scale Time-history analysis
May. 5, M5.3 Japan Nemuro-hanto Nanto-oki Earthquake
Research group of Xinzheng Lu at Tsinghua University ([email protected])
First reported at 06:00, May. 5, 2019 (Beijing Time, UTC +8)
Acknowledgments and Disclaimer
The authors are grateful for the data provided by K-NET and KiK-net. This analysis is for research only. The actual damage resulting from the earthquake should be determined according to the site investigation.
Scientific background of this report can be found at:
http://www.luxinzheng.net/software/Real-Time_Report.pdf
1. Introduction to the earthquake event
At 01:40 05 May 2019 (Local Time, UTC +9), an M 5.3 (JMA) earthquake occurred in Japan Nemuro-hanto Nanto-oki. The epicenter was located at 146.4 43.2, with a depth of 60.0 km.
2. Recorded ground motions
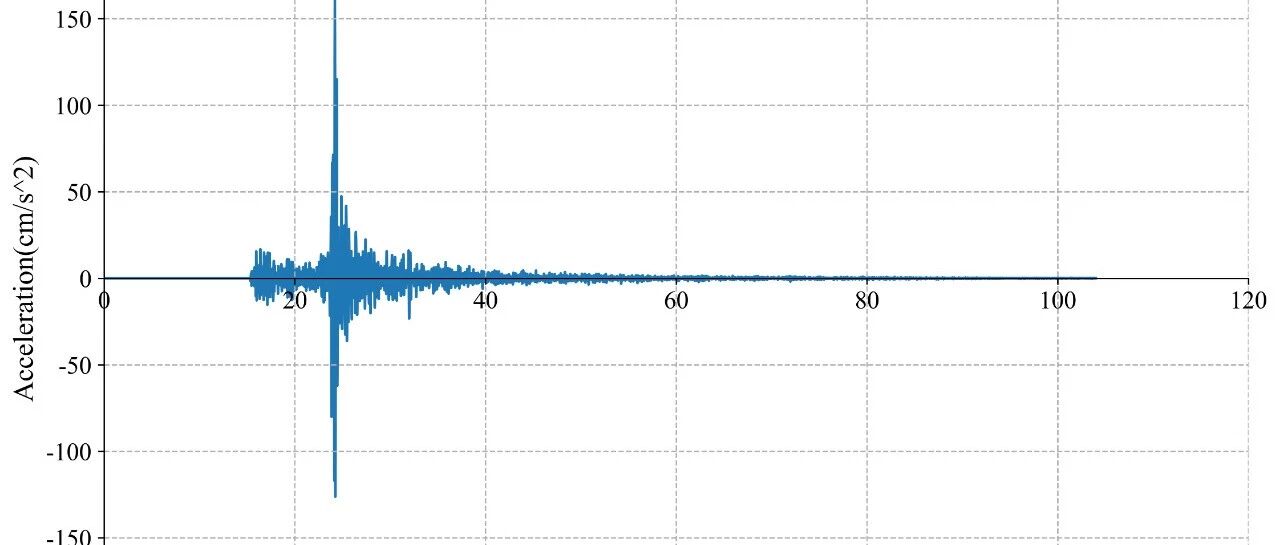
10 ground motions near to epicenter of this earthquake were analyzed. The names and locations of the stations can be found Table 1. The maximal recorded peak ground acceleration (PGA) is 164 cm/s/s. The corresponding response spectra in comparison with the design spectra specified in the Chinese Code for Seismic Design of Buildings are shown in Figure 1.
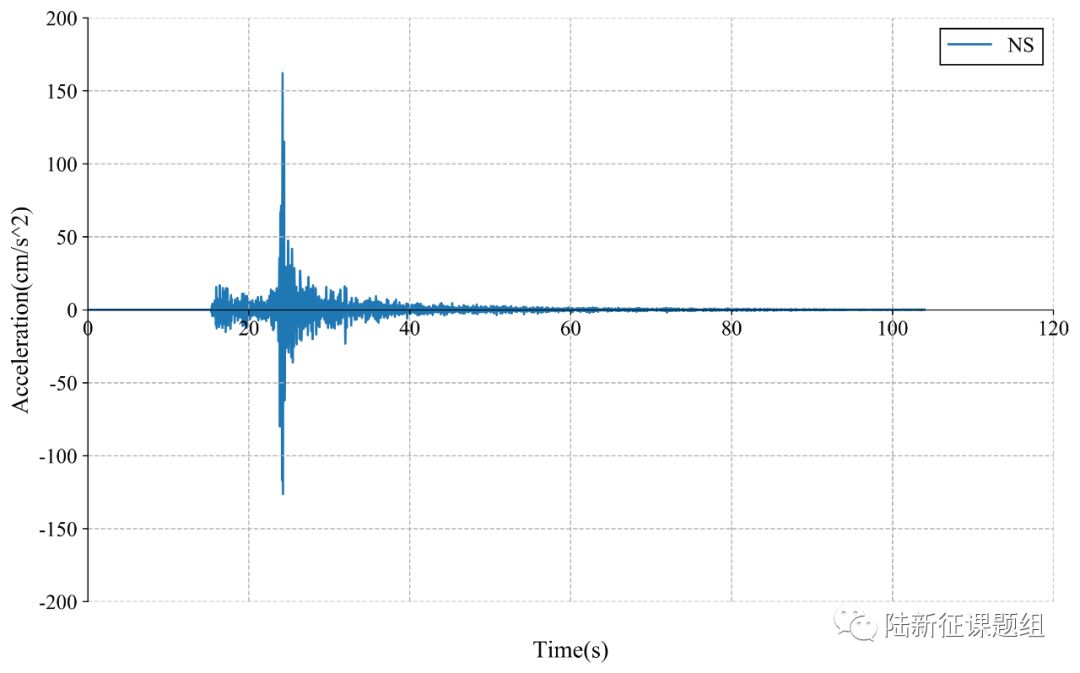

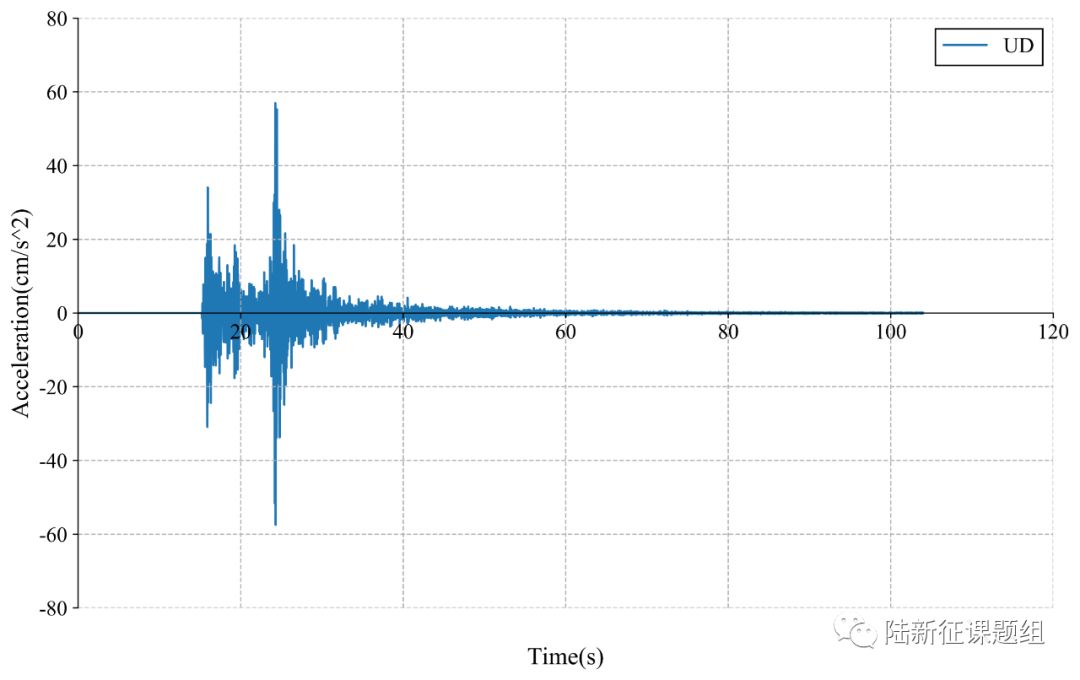
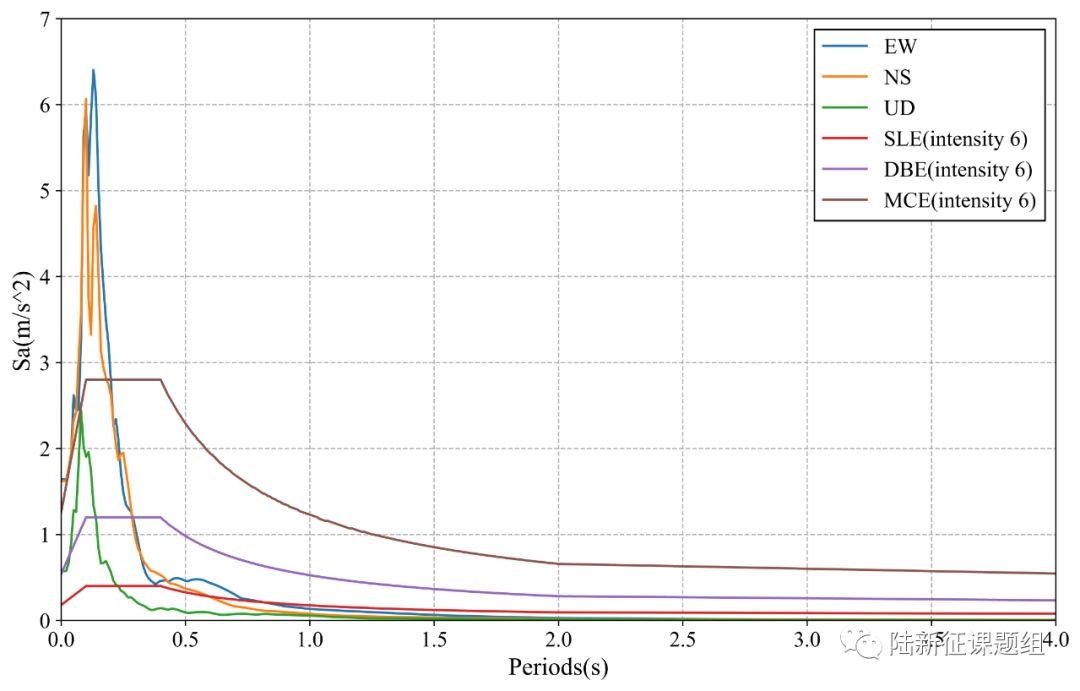
Figure 1 Response spectra of the recorded ground motions with maximal PGA
3. Damage analysis of the target region subjected to the recorded ground motions
Using the real-time ground motions obtained from the strong motion networks and the city-scale nonlinear time-history analysis (see the Appendix of this report), the damage ratios of buildings located in different places can be obtained. The building damage distribution and the human uncomfortableness distribution near to different stations is shown in Figure 2 and Figure 3, respectively. These outcomes can provide a reference for post-earthquake rescue work.
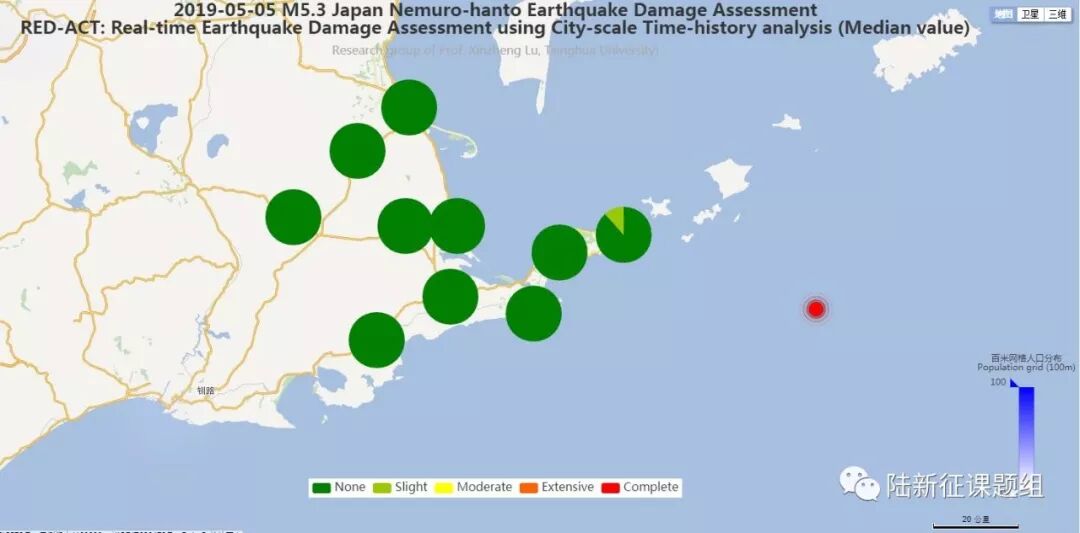
Figure 2 Damage ratio distribution of the buildings near to different stations
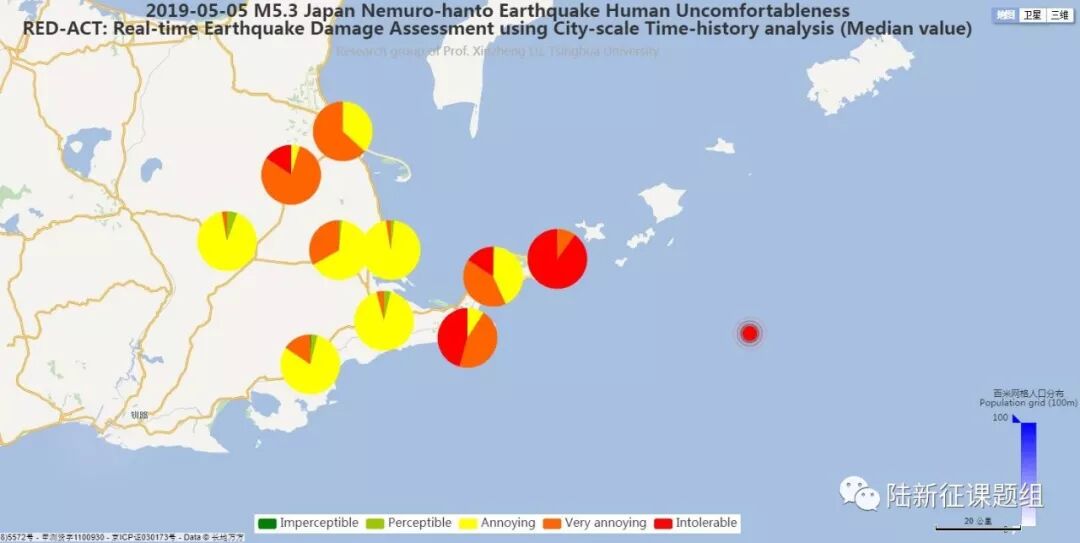
Figure 3 Human uncomfortableness distribution near to different stations
4. Earthquake-induced landslide of the target region subjected to the recorded ground motions
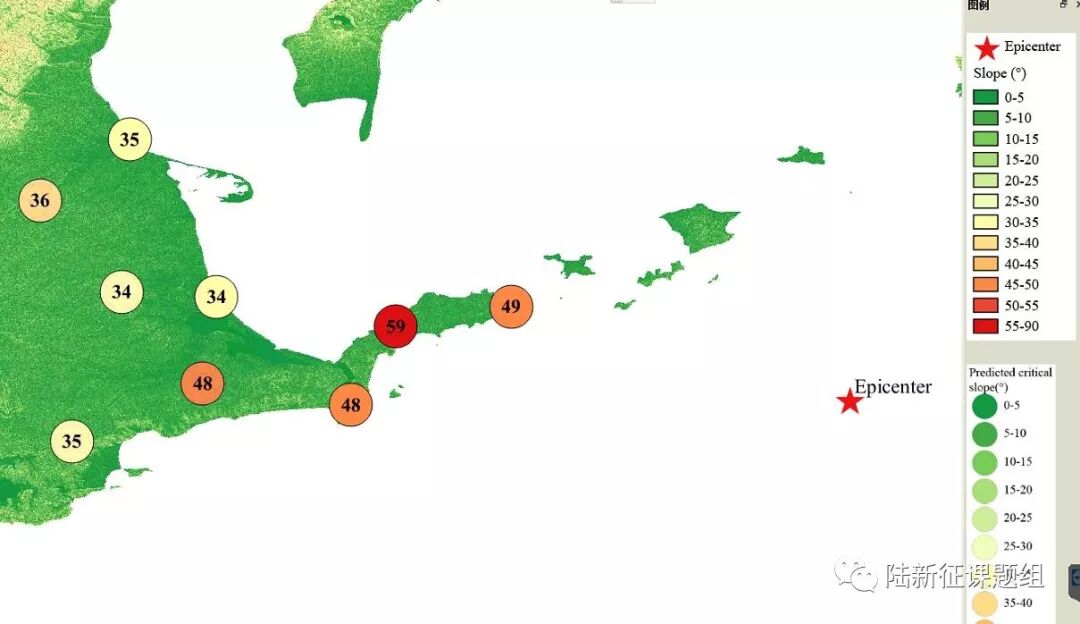
According to local topographic data, lithology data and ground motion records, the distribution of earthquake-induced landslide near to different stations under the different proportions of the landslide slab thickness that is saturated can be calculated, as shown in Figure 4. The basemap shows the distribution of the local slope. The number in the circle represents the critical slope of the landslide. The earthquake-induced landslide tends to occur with a higher probability when the slope is larger than this threshold value.

(a) The proportion of the landslide slab thickness that is saturated equals 0%
(b) The proportion of the landslide slab thickness that is saturated equals 50%
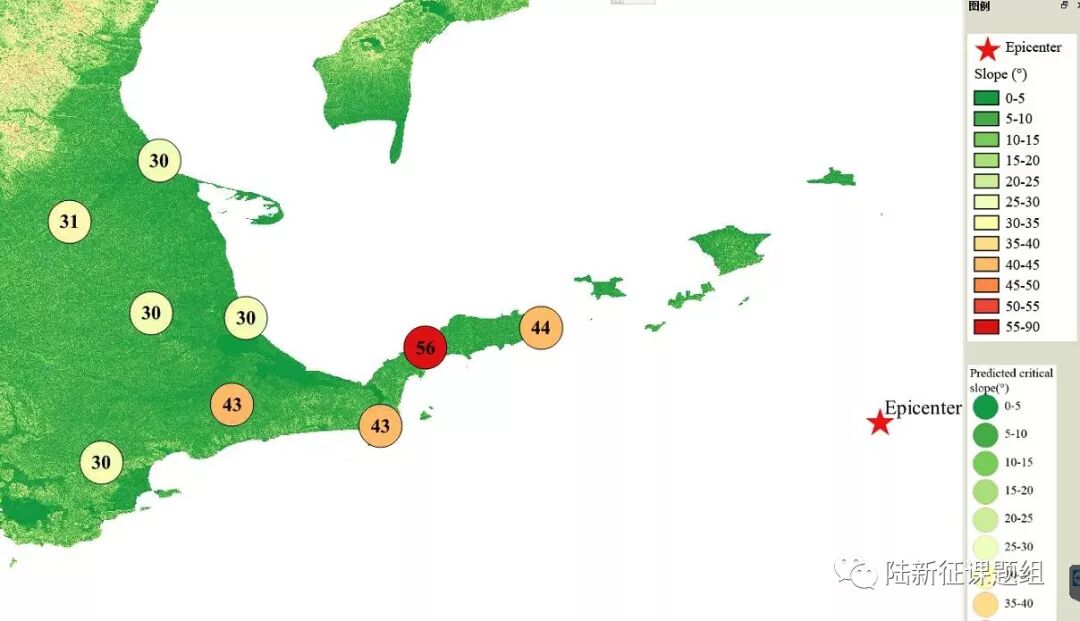
(c) The proportion of the landslide slab thickness that is saturated equals 90%
Figure 4 Distribution of earthquake-induced landslide near to different stations
Scientific background of this report can be found at: http://www.luxinzheng.net/software/Real-Time_Report.pdf
Table 1 Names and locations of the strong motion stations
No. Station Name Longitude Latitude
1 HKD066 145.131 43.6619
2 HKD067 144.973 43.555
3 HKD068 144.77 43.4108
4 HKD069 145.117 43.3941
5 HKD070 145.284 43.3852
6 HKD071 145.26 43.2326
7 HKD072 145.521 43.1948
8 HKD073 145.6 43.3327
9 HKD074 145.803 43.368
10 HKD075 145.029 43.1309
---End---
相关研究
长按识别二维码,关注我们的科研动态